Jonathan Kronstein and Eric Leininger, CME Group
AT A GLANCE
- U.S. debt issuance reached a record of nearly $3 trillion for the second quarter, with $947 billion expected for the third quarter.
- U.S. debt-to-GDP is set to rise 20 percentage points by the end of the 2020 fiscal year, with the Treasury’s focus on issuing long-term debt at current low interest rates
The massive deficit is a result of the economic fallout from the COVID-19 pandemic. The Congressional Budget Office (CBO) is projecting the debt-to-GDP ratio will rise significantly over the next two years; increasing by 20 percentage points at the end of 2020 and by 26 percentage points at end of 2021 relative to the CBO’s March baseline projections. The U.S. debt-to-GDP ratio is projected to break the prior record established in 1943, during World War II.
Total public debt as percentage of gross domestic product, percentage of GDP Quarterly, seasonally adjusted (1966-2020)
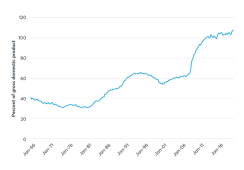
Source: Federal Reserve Bank of St. Louis Database (FRED)

Record Amounts of Debt
To finance this budget deficit, the U.S. Treasury will need to issue massive amounts of debt. At the quarterly refunding in August, the Treasury announced net issuance of $947 billion for Q3. This followed the record $2.753 trillion in realized borrowing from April-June.
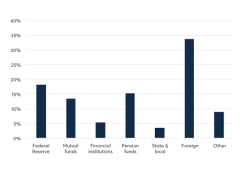
Holders of U.S. Treasury Debt
The Q3 borrowing estimate is $270 billion higher than announced in May. The increase is primarily driven by higher expenditures, due to a shift from the prior quarter and anticipated new legislation, largely offset by the higher beginning-of-July cash balance and higher receipts.
During the May refunding, the Treasury expressed a desire to issue increasing amounts of longer-term debt at these very low interest rates. Minutes from the Treasury Borrowing Advisory Committee (TBAC) stated, “Committee members favored increasing issuance of long-term securities in light of the large increase in financing needs, the importance of managing rollovers, and the historically low level of interest rates.”
Similarly, Treasury Secretary Steven Mnuchin said he is comfortable spending $3 trillion because the Treasury is locking in very low rates. The increasing issuance of Treasury notes and bonds with longer durations will most likely increase the need to hedge issuance with Treasury cash, futures, and options.
More and Longer-Dated Coupon Issuance
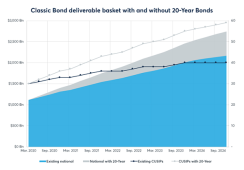
The U.S. Treasury was pleased with the results of the 20-year nominal bond auction in May and the subsequent re-openings in June and July. As expected, demand for this tenor is strong and market participants have provided significant positive feedback on the security.
Outstanding debt and average length of marketable interest-bearing public debt Monthly Jan 2000-March 2020
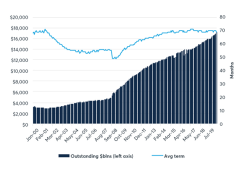
Sources: Congressional Budget Office, Department of the Treasury
Projected gross issuance of notes and bonds with fixed-rate coupons (excluding Treasury Inflation Protected Security [TIPS] and Floating Rate Notes [FRNs]) is $2.668 trillion, compared to $2.410 trillion in 2019 and $2.051 trillion in 2009. Comparing pre- and post-COVID-19 funding requirements from coupons issued during the January to March 2020 quarter of $579 billion to the most recent quarter of August to October of $934 billion is over a 60% increase in coupon issuance.
Accordingly, Treasury announced increases of $5 billion to both the new and re-opened 20-year bond auction sizes starting in August. Additionally, the 30-year will also see increases of $4 billion to both the new and reopened 30-year bond auction sizes. This additional issuance and duration in the long-end could lead to a rate concession out the curve.
Treasury also announced in August increases of $6 billion to both the new and reopened 10-year note auction sizes.
Over the next three months, Treasury anticipates increasing the sizes of the 2-, 3-, and 5-year note auctions by $2 billion per month. As a result, the size of auctions for each of these notes will each increase by $6 billion by the end of October.
Treasury issuance ($Blns) 2020, 2019, 2009
Source: CME Group Research and Product Development based on May refunding announcement
Treasury also anticipates increasing the size of the 7-year note auction by $3 billion per month over the next three months. As a result, the size of the 7-year note auction will increase by $9 billion by the end of October.
Treasury issuance is a complex yet important process to help the functioning of the government and global capital markets. As these dynamics continue to play out, the level and structure of interest rates will be an important area to watch.
Read the full report on recent U.S. Treasury issuance, covering
- Debt levels relative to GDP continuing to grow
- Growing coupon issuance composition and complexity
- Why the U.S. debt maturity profile continues to lengthen
- How the Federal Reserve actively uses its balance sheet to support its mandate