As seen throughout 2025, volatility in asset prices can lead to challenges for institutional investors in maintaining and adjusting their strategic asset allocation policies. It also leads to intermediate-term opportunities to invest in more attractive assets for those with a well-researched approach to forecasting the fair value and expected return of an asset class. Morningstar recently enhanced its equity forecasting model by incorporating bottom-up fundamental insights from its sizable equity research team, adding a more robust view of fair value across equity markets. The model’s current forecasts show a shift in geographic equity preference and highlights areas of opportunity within the US equity market.
Portfolio Construction Ideas
Morningstar analysts currently favor an underweight allocation to U.S. Equities and a subsequent overweight allocation to targeted non-U.S. exposures. While there is no doubt the U.S. market contains many of the strongest and most successful companies around the world, that does not mean it always offers the best investment opportunity. While companies like Apple, Meta, and Nvidia have some of the strongest growth prospects globally, Morningstar sees their current pricing as simply too high on a price to fair value basis. In fact, the U.S. Market currently ranks near the bottom of global markets in terms of expected returns, with countries like Korea, Great Britian, and Japan all ranking above the U.S. From a regional perspective, they believe the emerging markets of Latin America and Asia rank well above the U.S. as well. FX risk relative to the U.S. Dollar plays a factor, and has been impactful in 2025 as the strength of the U.S. Dollar seen the last few years has subsided as foreign currencies have shown relative appreciation.
Even though Morningstar research shows the U.S. market is overvalued as a whole, they still believe there is significant opportunity within it, as fortunately investors don’t have to choose between “all or none” in their allocations. Their research currently sees the Small-Cap segment of the market as a significant relative value opportunity compared to Large-Caps. Small Caps’ returns have lagged recently, further widening the gap in expected returns based on their modeling. Certainly, Small Caps can be more volatile and economically sensitive, but the current valuation difference could more than compensate investors over the medium to long term.
Small-Caps Have Lagged and Look Cheap Using Forward Looking P/E Ratios
Sustained underperformance, combined with attractive forward-looking valuations make small-caps attractive and support increasing the overweight.
Small-Caps Have Consistently Underperformed Mid- and Large-Caps
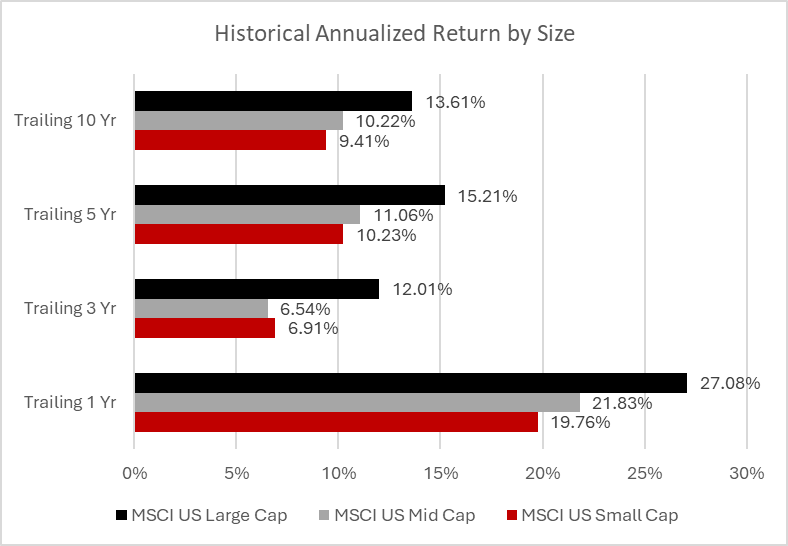
Morningstar Direct Data as of April 30, 2025

Forward Looking P/E Differential at Multi-Decade Low
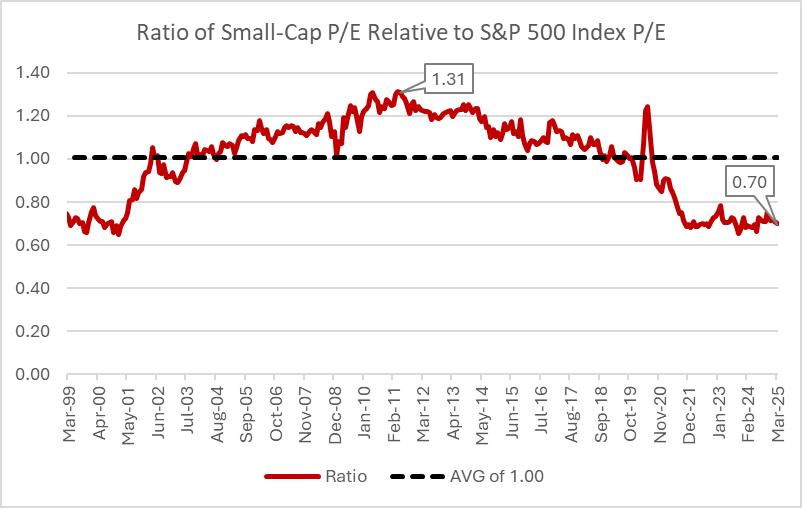
FactSet Data as of April 30, 2025
There is certainly a contrarian component built into these allocation opportunities but as described below, there is far more work being done to support these conclusions. Morningstar continually back tests and evolves their models and forecasts to adjust for a host of both bottom-up and top-down variables. Their assumptions benefit greatly from the depth of a large and seasoned global team as well as the broader resources of Morningstar as a whole.
Research Methodology
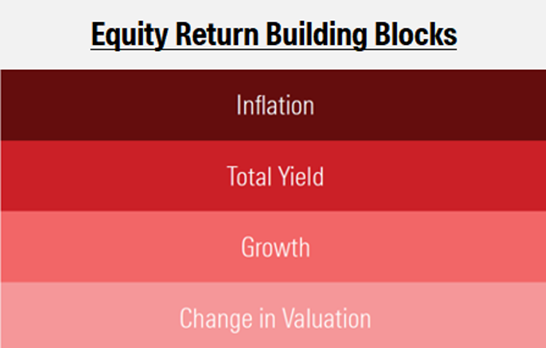
The equity expected return model is rooted in the belief that over the long term, the economy supplies return to investors in the form of cash flows. These cash flows can be retained and grown (growth) or distributed in the form of dividends and share buybacks (total yield). In the short term, market prices dictate the valuation of an asset class. Morningstar’s forward-looking 10-year equity asset class return incorporates the valuation multiple you pay today versus what they believe is a fair valuation multiple (change in valuation). This can be accretive or destructive to expected return.
This explanation is important, as it highlights how valuation – specifically, the change in valuation multiples – can significantly influence the expected return of equities over the intermediate term. In supply-side models, returns are broken into components like growth and yield, which are tied to fundamentals like earnings and dividends. But valuation change- how expensive or cheap the market is relative to long-term fair value – can sharply amplify or reduce total return, especially over a decade-long horizon. If one overpays, (high valuation multiples), future returns are likely to be lower. If one underpays (low multiples), returns can be higher even if fundamentals don’t change much.
This unique approach by Morningstar uses historical valuation norms (base rates) to define a fair valuation and assess current pricing. It leverages their equity research to aggregate price-to-fair-value estimates from individual stocks. This two-pronged method gives a more robust and cross-validate estimate of how much valuation might revert – and what that means for expected returns.
So, if other investors utilize supply side expected return models, what makes this approach unique? They view the change in valuation as the most volatile and subjective component of an investors’ expected return and approach it from both a top-down and bottom-up perspective. The firm’s Multi-Asset Research group adjusts historical asset class level base rates to provide an expected forward-looking fair long-term valuation multiple. This is then compared to prevailing multiples to forecast asset class price impacts of a reversion to fair. Additionally, the process incorporates Morningstar’s Equity Research group, rolling up individual company price-to-fair values to get another valuation lens for an aggregate asset class. This combination is a powerful way to attempt to capture the true impact of current market prices versus their true long-term value.
But why does this change in valuation matter so much when forecasting intermediate-term expected asset class returns? A deeper look into why valuation is such an important component of asset class forward-looking returns provides further insight.
Why price/valuation matters
Whether asset prices are forecastable is one of the most widely studied questions in economics. For a long time, it was well accepted among academics that asset prices followed a random walk, and therefore the best estimate of future returns was simply the long term average.
This is in contrast to Graham and Dodd’s famous work in which the price you pay is one of the most important considerations an investor needs to account for before making any investment. Shiller and Campbell provided empirical evidence for this proposition by showing that valuation ratios do forecast forward returns, and this relationship increases in strength with time period.
While Shiller and Campbell focused primarily on some variant of dividends and earning ratios, Straehl shows the importance of including buybacks in this calculation. This is a result of the fact that over recent decades corporates have chosen to use buybacks instead of dividends to return cash to shareholders. Buyback data is also more volatile than dividend data, so to provide a more useful measure, Straehl, proposes using a ratio of price to a 10 year average of real total payouts, termed cyclically adjusted total yield (CATY).
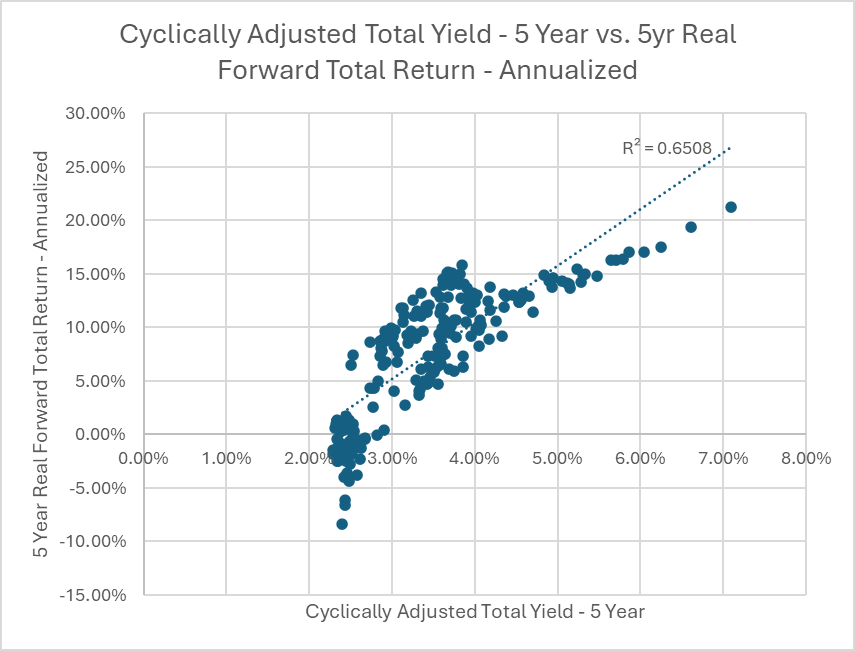
In the figure below, Morningstar provides empirical support for this. They regress Cyclically adjusted total yield (CATY10) against 10 year forward returns (annualized). Rather than using current yield, CATY10 is used, which is calculated using the average of the past 10 year real total payouts due to the greater volatility of buybacks.
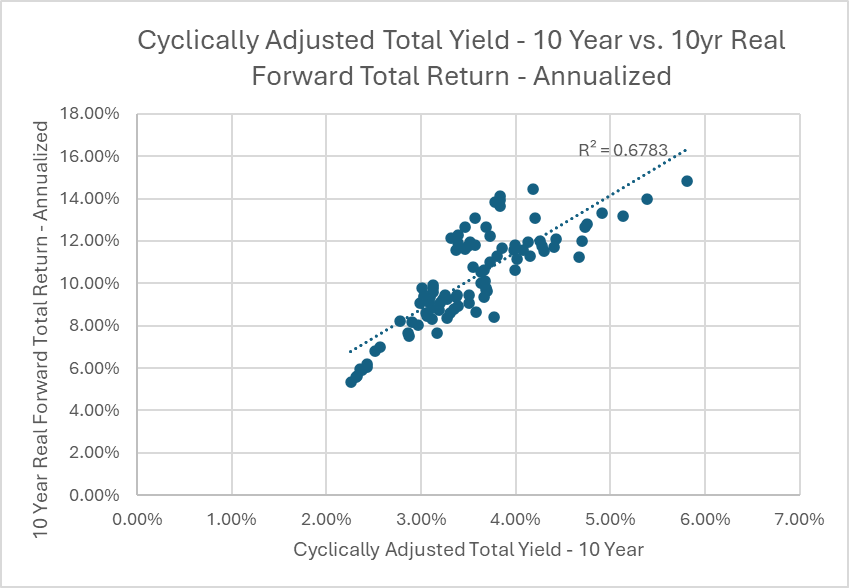
For illustrative purposes only. Past performance is no guarantee of future results.
Empirically, they estimate the relationship hold on a 5-year time frame, supporting more intermediate term horizon allocation decisions.
For illustrative purposes only. Past performance is no guarantee of future results.
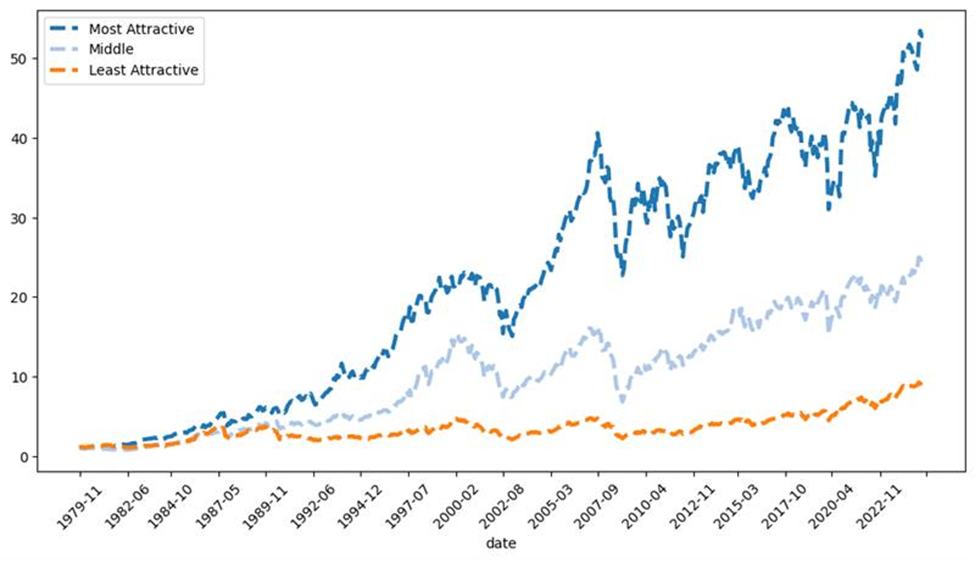
While the primary focus has been the U.S. equity market thus far, the firm takes a cross-sectional look as well to see if the relationship still holds. Below, it is shown how this looks if three portfolios are formed, sorted on asset valuations. Assets are sorted into three buckets, classified as most attractive for the lowest valuation and least attractive for those with the highest valuation. $1 invested in the former would be worth $52 compared to only $8 for the latter, again demonstrating the importance of valuation for making investment decisions.
 For illustrative purposes only. Past performance is no guarantee of future results.
Morningstar’s research breadth and principled approach to complex asset allocation decisions is well-suited to complement and support institutional investors with the flexibility to help take advantage of price dislocation in markets over the intermediate term. When supported by robust research, the reward-for-risk of investor portfolios can be enhanced through asset class forecasting, rebalancing, and strategic asset allocation adjustments. Morningstar has been a leading advocate for investors for over four decades, incorporating views on valuation and expected returns in their widely followed capital markets and asset allocation research. The firm’s legacy dates back to the seminal “Stocks, Bonds, Bills, and Inflation®” (SBBI®) study conducted by Roger G. Ibbotson and Rex A Sinquefield in 1976, which laid the foundation for understanding the risk and return characteristics of various asset classes. Today, Morningstar offers extensive forecasts covering over 200 unique equity, fixed income, and alternative asset classes, as well as currencies, leveraging its broad and deep research capabilities to meet the evolving needs of institutional investors.
Disclaimer
Opinions expressed are as of the current date; such opinions are subject to change without notice. Morningstar, Inc. and its affiliates shall not be responsible for any trading decisions, damages, or other losses resulting from, or related to, the information, data, analyses or opinions or their use. The information, data, analyses, and opinions presented herein do not constitute investment advice, are provided solely for informational purposes, and therefore are not an offer to buy or sell a security. Please note that references to specific securities or other investment options within this piece should not be considered an offer (as defined by the Securities and Exchange Act) to purchase or sell that specific investment.
Forward-looking statements and projections involve known and unknown risks, uncertainties and other factors which may cause the actual results to differ materially and/or substantially from any future results, performance or achievements expressed or implied by those projected in the forward-looking statements for any reason.
Investment research is produced and issued by subsidiaries of Morningstar, Inc. including, but not limited to, Morningstar Research Services LLC, registered with the U.S. Securities and Exchange Commission. Advisory services are offered by subsidiaries of Morningstar, Inc. who are authorized in the appropriate jurisdiction to provide such services. In the United States, one of those entities is Morningstar Investment Management LLC, a registered investment adviser.
All investments involve risk, including the loss of principal. There can be no assurance that any financial strategy will be successful. Investors should seriously consider if an investment is suitable for them by referencing their own financial position, investment objectives, and risk profile before making any investment decision.
Investing in international securities involve additional risks. These risks include, but are not limited to, currency risk, political risk, and risk associated with varying accounting standards. Investing in emerging markets may increase these risks.
Stocks of small and mid-cap companies tend to be more volatile and less liquid than stocks of large companies. Small and mid-cap companies, as compared to larger companies, may have a shorter history of operations, may not have as great an ability to raise additional capital, may have a less diversified product line making them susceptible to market pressure, and may have a smaller public market for their shares.