Dr. Mark Shore and Michael Copeland, CME Group
At a Glance
- The CME Group Volatility Index (CVOL) is a suite of implied volatility indices, measuring 30-day forward volatility across all option strike prices of key futures markets.
- Volatility indices may be considered a sentiment indicator as they attempt to capture the view of a wide range of options-market participants.
While we often focus on the price of a futures market, the options market can tell us an entirely different, and equally important, story.
CME Group’s CVOL Skew Ratio is a tool designed to help uncover that story by revealing the collective sentiment of market participants. It's built on CVOL, a series of indices that measures expected 30-day volatility across key futures markets.
This ratio is calculated by comparing the volatility of out-of-the-money call options (related to upward price movements) to the volatility of out-of-the-money put options (related to downward price movements).
How to Interpret the Skew Ratio
- When the Ratio is above 1: This suggests that market participants are expecting an upward trend in the underlying futures market.
- When the Ratio is below 1: This indicates that participants are anticipating a downward trend in the futures market.
- When the Ratio fluctuates around 1: This suggests no clear direction for the market.

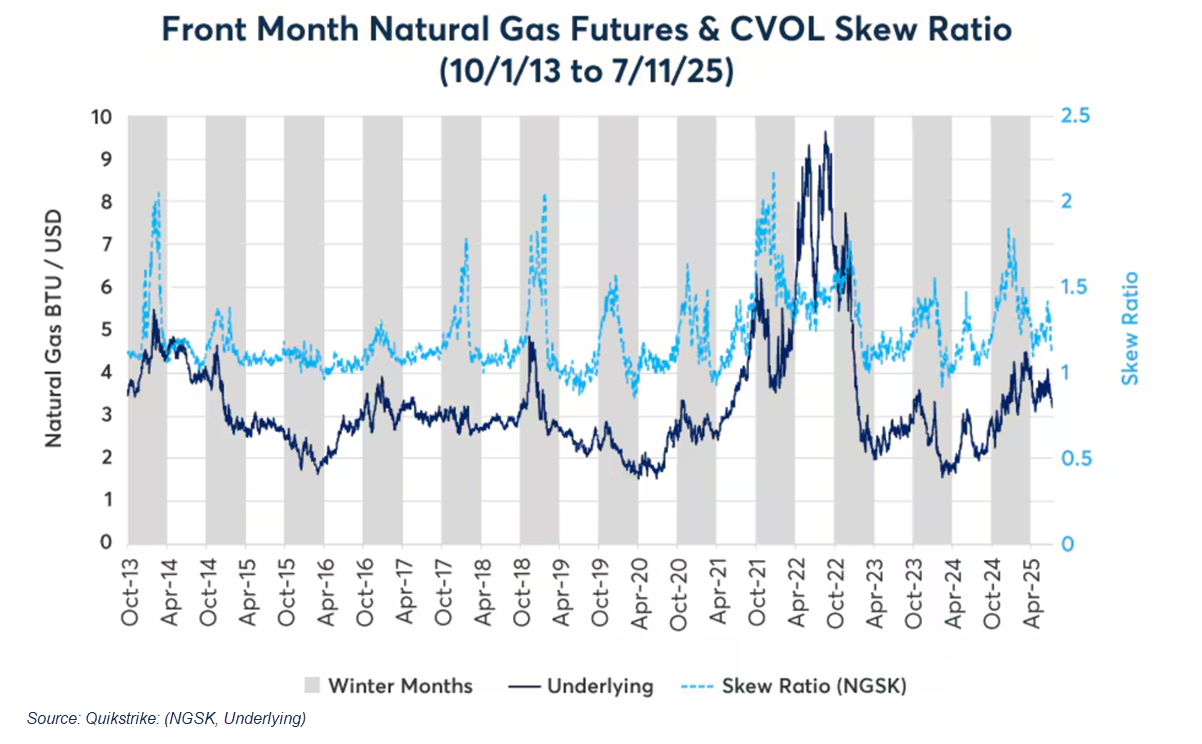
Case Study 1: Natural Gas - Seasonal Sentiment
The natural gas market is a perfect example of the skew ratio in action. During winter, demand for heating energy can surge unexpectedly. This is reflected in the natural gas skew ratio, which often rises during these colder months. This rise isn't random; it shows that options traders are actively seeking upside protection against potential price spikes. The winter of 2018-2019 is a classic case, where a cold snap caused the ratio to surge, reflecting the market's expectation for higher prices due to increased demand.
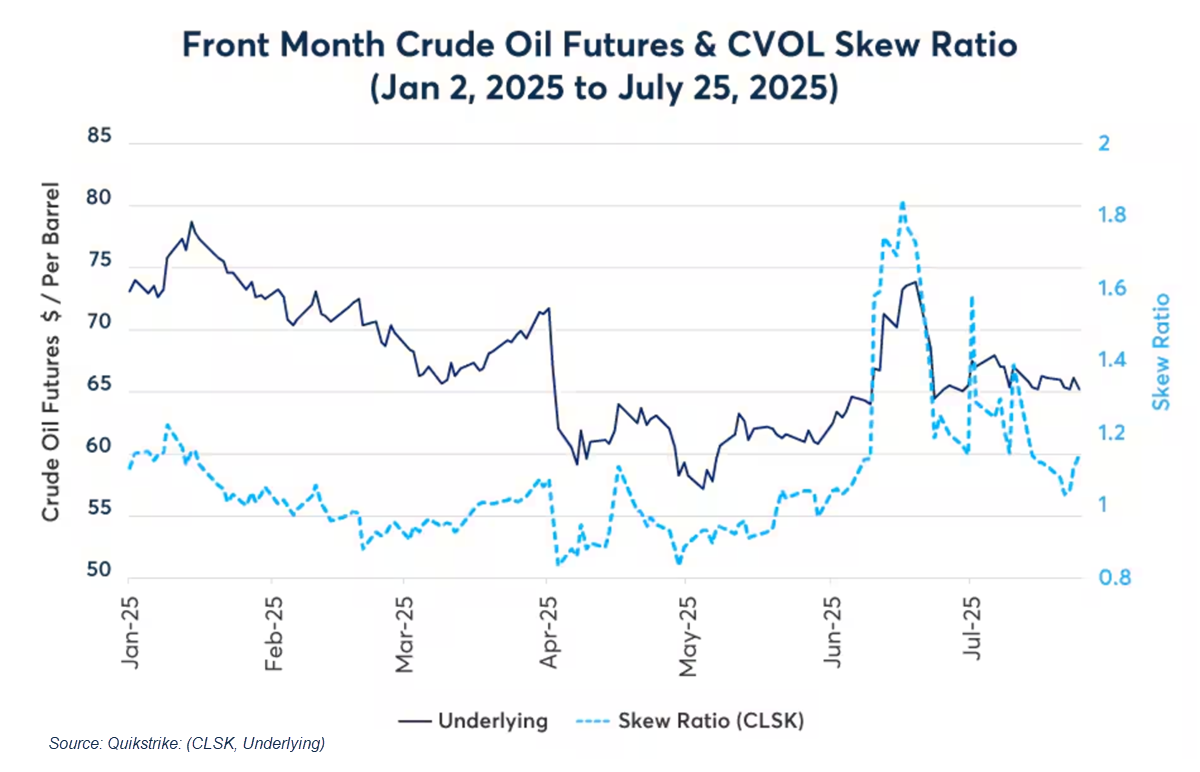
Case Study 2: Crude Oil - A Shifting Narrative
Crude oil provides another compelling example, showing how the skew ratio often moves in tandem with the price of crude oil futures. In early May 2025, as crude oil prices fell below $60 a barrel, the skew ratio was below 1, suggesting a sideways or declining market.
However, as geopolitical tensions in the Middle East began to escalate between May and June, the narrative shifted dramatically. As crude oil prices rallied, the skew ratio climbed from below 1 to a high of 1.8. This surge demonstrated that market participants were now actively seeking upside protection in the face of potential supply disruptions, signaling a clear shift in sentiment toward a more bullish outlook.
Ultimately, the CVOL Skew Ratio may offer a valuable pulse check on market sentiment. It provides a unique lens through which to view futures markets, revealing the directional bias that options traders are collectively expressing. When analyzing a futures market, asking what the options market suggests via the skew ratio can provide a crucial piece of the puzzle.
CME Group futures are not suitable for all investors and involve the risk of loss. Full disclaimer. Copyright © 2025 CME Group Inc.