Payal Shah, CME Group
At a Glance:
- CME Group’s E-mini S&P 500 ESG Index futures have become one of the most liquid ESG equity index futures contract globally
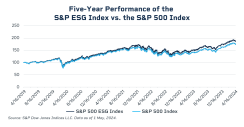
- The S&P 500 ESG Index has outperformed the S&P 500 by a cumulative 15.1% over five years
Since then, ESG investing has been growing at pace, with recent economic and social trends leading to higher prioritization by investors to include ESG-focused firms in their portfolios. It is estimated that global sustainability-linked assets could reach $50 trillion by 2025.
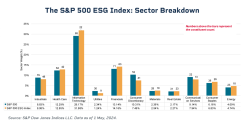
The S&P 500 ESG Index is a broad-based index, measuring the performance of S&P 500 companies that meet sustainability criteria while maintaining similar industry group weights, and similar risk and return profile as the S&P 500.
Looking through an ESG lens may help tease out risks that might not necessarily be apparent in conventional financial analysis. By excluding the lower scoring ESG companies relative to their peers, some risk is managed out of the index.
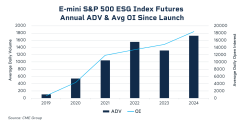
A clear sign of current increased investor adoption is the growth of CME Group S&P 500 ESG Index futures, which have become one of the most liquid ESG equity index futures contracts globally. Open interest has reached record levels of approximately $4.6 billion notional value this year as investors use these products to achieve exposure to U.S. large-cap stocks with stronger sustainability credentials.
The main source of early adopters into the futures contract comes from EMEA, with interest coming from both the U.S. and Asia. For Asia, the interest had originally been confined to a couple of countries such as Australia and Japan, but there is now more engagement throughout the region.
Many observers believe that screening for companies with high ESG scores is a way to find companies with overall stronger management. This can include factors like a strong climate strategy, thoughtful executive teams, foresightful risk management, strong governance, a focus on supply-chain transparency and robust information and cyber-security.
The S&P 500 ESG Index applies business-activity screening, achieved primarily by avoiding or underweighting the lowest ESG-scoring constituents, as well as companies classified as non-compliant with the United Nations Global Compact. Furthermore, companies that are in the bottom quartile by ESG-score within their respective sector are excluded.
The S&P 500 ESG is a potential solution for those seeking to adopt an index product to meet the requirements of regulations such as Article 8 of the EU Sustainable Finance Disclosure Regulation. Carbon reduction is not the objective of the S&P 500 ESG index, but an improvement was also observed.
Metrics of S&P 500 ESG vs S&P 500 Parent Index
| Index | S&P 500 ESG | S&P 500 |
| Number of stocks | 324 | 503 |
| Weight of Top 10 Constituents | 40.11% | 33.8% |
| ESG Score | 50.70 | 46.10 |
| ESG Score Improvement vs Parent | 11.87% | - |
| Weighted average carbon intensity | 109.72 | 134.31 |
| Carbon Efficiency (tC02e/mnUSD) | 131.38 | 154.85 |
| Carbon Footprint (tC02e/mnUSD) | 38.17 | 44.42 |
| Fossil Fuel Reserves | 447 | 445 |
| Source: S&P Dow Jones Indices LLC. Data as of May 1, 2024. | ||
Until the third quarter of 2021, the S&P 500 and the S&P 500 ESG index exhibited similar performances. By the fourth quarter of 2021, the S&P 500 ESG index began to steadily outperform the S&P 500 by four points on average. Now in its fifth anniversary since launch, the S&P 500 ESG Index has outperformed the S&P 500 by a cumulative 15.1% as of early May.
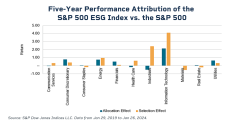
The S&P 500 ESG Index continues to be refined to reflect the sentiments of a sustainability-minded investor. The updates to exclusions and eligibility requirements reflect the growing need for index providers to properly account for companies’ business activities, which ultimately ensures ESG investors can accurately assess the behavior of those companies within the index.
At this year’s rebalance, which occurred on May 1, Amazon and Netflix were among the biggest names moved out, while Exxon Mobil Corp and Costco Wholesale Corp were added in. This year, 57 stocks were added and 47 removed, bringing the total number of components in the rebalanced index to 324, up from 314 in 2023.
Biggest Additions and Exclusions to the S&P 500 ESG Index in the 2024 Annual Rebalance
| Top 10 Biggest Additions | Top 10 Biggest Exclusions |
| Exxon Mobil Corp | Amazon.com Inc |
| Costco Wholesale Corp | NetFlix Inc |
| Accenture plc A | Thermo Fisher Scientific |
| Intl Business Machines Corp | Intuit Inc |
| Danaher Corp | Verizon Communications Inc |
| Uber Technologies Inc. | ConocoPhillips |
| Stryker Corp | Texas Instruments Inc |
| Marsh & McLennan Companies | Progressive Corp |
| Fiserv Inc | Vertex Pharmaceuticals Inc |
| T-Mobile US Inc | EOG Resources |
| Source: S&P Dow Jones Indices LLC. Data as of April 30, 2024. | |
Important ESG-related catalysts in 2024 will be the possible development of EU further regulation that imposes parameters surrounding Sustainable Finance. From a regulation standpoint, advisors will have to ask clients about their sustainability preferences, there are more disclosure requirements on companies and asset managers must state how they are managing ESG risks.


