Authors William Craig, Investment Director and Mark Watson, Investment Specialist
“How did you go bankrupt?” Bill asked. “Two ways,” Mike said. “Gradually and then suddenly.” – Ernest Hemingway, The Sun Also Rises
Following a decade of low interest rates, which accelerated deals in the venture ecosystem and increased their size, we believe a new “higher-for-longer” rate environment will create challenges for venture-backed businesses in many sectors. While this dynamic will take time to play out, companies that prove unable or unwilling to adapt to the new normal may see cash runways dwindle, then end abruptly.
One lesson that has emerged in the wake of this shift is the importance of investing in businesses with strong, durable fundamentals, particularly capital efficiency. Capital-efficient companies generally demonstrate a path to lasting profitability and sustainable growth, with relative immunity to macroeconomic headwinds. In this article, we investigate the impact of interest rates on venture capital activity — including the ability of companies to reach “unicorn” status, discuss the key metrics for analyzing capital efficiency in late-stage venture capital companies, and posit what may lie ahead for participants across the venture capital ecosystem.
Are higher interest rates a unicorn killer?
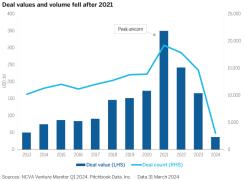
When the term unicorn was first coined in 2013, there were roughly 40 companies elevated to this rarefied status. While the definition of unicorn varies, PitchBook describes it as: “a venture-backed company that raised a round at post-money valuation of US$1 billion or more.”1 Over the next 10 years, the number of unicorns has grown exponentially to more than 700 US companies, almost 50% of which reached the threshold during the height of VC investments in 2021 (Figure 1).
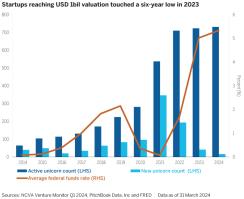
So, what happened? The low interest-rate environment catalyzed a significant and rapid expansion in the number of venture fund managers and corresponding higher levels of capital deployment, which,together, increased demand shocks across the venture financing landscape. Graduation rates (the pace at which companies progress from one stage of financing to the next) rose across the board, and deals closed in progressively shorter periods, often under 12 months. Thresholds for a company’s size, scale, and profitability relaxed, while valuations skyrocketed. In the SaaS sector, companies were often valued at higher multiples if they were burning capital, as opposed to accumulating it. In short, everyone was making a tremendous amount of money until 2022, when suddenly, they were not (Figure 2).
Figure 1 shows the inflection in deal value and volume following the initial rate hikes in 2022 while Figure 2 shows the dramatic decline in new unicorns.


Today, more than 90% of unicorns enjoy that status on paper only, as they have yet to raise capital in the current environment.2 We believe many will struggle to raise financing rounds based on their highwater valuation during the zero-interest-rate period, and new start-ups will find it increasingly difficult to raise successive rounds. According to some estimates, 40% of these active unicorns are trading below US$1 billion on the secondary market.3
Assessing capital efficiency in late-stage companies
This changing landscape provides an opportunity to reflect on which metrics are reliable indicators of a company’s long-term success, regardless of the macroeconomic backdrop. If the valuation of many active unicorns is questionable, how can investors determine which to support and how to price them?
We previously discussed venture capital growth efficiency metrics focused on early-stage companies. Here, we will focus our discussion on late-stage company metrics that can help investors assess a company’s capital efficiency (and therefore, likely durability). It is important to review a variety of metrics, stress test assumptions, and consider return-scenario implications as a company continues to grow and scale. In our view, key metrics include:
Total Addressable Market (TAM)
These metrics can vary by a company’s stage, sector, and operating region, so it is important to benchmark across competitors and public-market incumbents.
Greater efficiency needed across the board
As the cost of capital rises — a function of both interest rates and reduced venture fundraising — it seems likely that companies will be increasingly scrutinized for capital efficiency. Such a rationalization is already in motion, with heavily funded firms such as Convoy and Hopin going under,4 and we believe these large-scale failures may continue over the next few years, as cash runways dwindle.
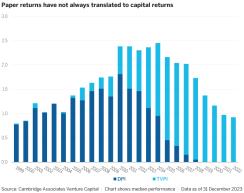
Portfolio companies are not the only ones that need to defend their capital efficiency. With distributions from venture capital funds dropping 84% from 2021 to 2023,5 many limited partners are asking venture fund managers difficult questions about their process, philosophy, and largely unrealized performance over the past decade. That is likely because, despite a decade of robust activity, punctuated by a tremendous liquidity environment in 2020 and 2021, most venture fund managers have returned very little capital to their investors. As an example, considering standard 10-year fund terms, 2014 vintage funds were optimally timed to take advantage of the market environment, particularly in 2021. Yet, the Cambridge Associates Venture Capital Benchmark shows a median Total Value to Paid-In (TVPI) for 2014 of 2.5x, with only 0.9x Distributed to Paid-In (DPI) returned to investors (Figure 3). The figures for the 2017 cohort are even more stark, with a median TVPI of 2.0x and a DPI of only 0.1x.

What lies ahead
Despite ongoing headwinds, we are optimistic about the future of venture capital. Rates have been above their lows for more than two years, and in that short window, companies and investors have already begun laying the foundation for durability. We remain in a period of extraordinary innovation, with exciting, disruptive companies emerging across almost every sector. These businesses will likely need funding from private markets to continue to grow.
Learn more about Private Investing at Wellington
1“Post-money” refers to a company’s value after raising capital in a financing round. | PitchBook Data, Inc. no longer considers the company a unicorn if it loses venture backing because it goes public or is acquired, or if its valuation falls below the US$1 billion threshold; for example, because it went out of business or had a down round.
2Rosie Bradbury, “Despite AI boost, unicorn creation hits 6 year low,” PitchBook Data, Inc., 17 January 2024.
3Ibid.
4Spencer Soper, et al., “Bezos-backed Convoy, once valued at $3.8B, shuts down,” Fortune, 19 October 2023; Ingrid Lunden, “Hopin, the struggling virtual conference unicorn, sells events and engagement units to RingCentral,” TechCrunch, 2 August 2023.
5“2024 US Venture Capital Outlook,” PitchBook Data, Inc., December 2023. Distributions from US VC funds aged five- to 10-years old, from 30 September 2021 to 30 September 2023.


