After a number of years in which central banks were more concerned with fighting the risks of deflation, several signs point to a higher inflation environment in the US. Over the last 12 months, oil prices have shot up by almost 30%. The US economy is at “full” employment, with businesses reporting a shortage of skilled workers and an unemployment rate below 5%. Wage growth – initially sluggish – has also started to pick up in recent months, albeit without inducing major wage gains as yet. According to OECD estimates, growth should remain above potential this year with the usage of industrial production capacity currently running at close to 80%. At Lyxor, we believe such pressures in the productive apparatus will eventually translate into higher consumer prices.
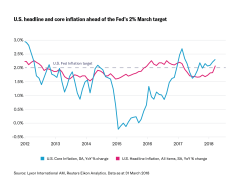
Some of these effects are already apparent. For the first time in almost a year, headline inflation (CPI) and core inflation (which excludes volatile components such as energy prices) printed above the Fed’s 2.0% target in March. Higher inflation could well propel the push for higher speed policy normalisation. According to the March FOMC Minutes, Fed officials have grown more confident in the inflation outlook, barring the realisation of downside risks to their projections. Strong inflation reports in March and April should keep the Fed on track for a 25 basis points rate hike in June – and enable it to deliver four in total this year. However, we do not believe that the inflation rate will ramp up too dramatically in the period ahead. Technological developments in areas such as healthcare or communications, unconventional petroleum production and greater investment in productive capacities are factors that could counter at least some of the inflationary pressures.
US headline and core inflation ahead of the Fed’s 2% March target
Asset selection becomes more complicated
Despite the relatively benign nature of the above, investors are increasingly concerned by other issues. Asset allocation has become more complex given greater political risk (like the possible trade war between the US and China), less support from central banks, and the high valuations most traditional asset classes are displaying. As a result, we expect to see a volatility regime shift, with markets much more volatile than they have been in recent years. Some of the market moves we’ve seen in February and March were, in our view, the precursors for this period of instability.
The positive correlation between the returns of fixed income and equity assets also impedes efforts to diversify portfolios more effectively. Historically, investors who adopt more cautious positions tend to reduce their exposure to equities and increase their weighting to fixed income. That may not, however, be wise in a rising inflation environment where greater caution is required on conventional bonds. Inflation-linked bonds may be better suited to this new normal.

Right place, right time
Our research shows assets related to inflation tend to perform well in the more advanced stages of the economic cycle. The expansion in the US is undoubtedly entering old age – so the probability of a recession in the next two years is increasing.
Holding commodities, most notably petroleum products, tends to prove beneficial in advanced stages of the cycle (especially 12 months before a recession), both in terms of absolute and risk-adjusted returns. The analysis takes into account US economic cycles, as measured by the National Bureau of Economic Research, since 1970. Inflation breakevens have also been fairly well supported by the recent move in energy/oil prices (Brent crude was above $72/bbl on 17 April). Meanwhile, net flows into short-dated TIPS ETFs have been fairly robust over the past month (despite net outflows in March from all-maturities ETFs).
While energy price moves are difficult to predict in the near-term, the possibility of weather-related or geopolitically induced spike in oil prices remains. They should nonetheless continue to underpin higher inflation expectations. Actual inflation prints, on the other hand, will continue to benefit from positive base effects (temporary slowdown in telecommunications and airfares in 2017) ahead of the summer.
Lyxor’s key calls
For now, we are looking to overweight assets such as TIPs and inflation breakevens, as well as commodities and those equity sectors that are most sensitive to inflation expectations.
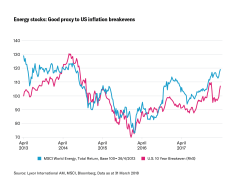
In equities, energy stocks offer a good proxy to oil prices and US inflation breakevens. The global energy sector offers an attractive dividend yield of around 3.75% (i.e. positive carry) vs. the negative carry of investing in futures-based strategies. The latter underperform when the futures curve is in contango (futures price above the expected spot price) – which is typically the case with oil. Financials also remain a pure cheap way to play global reflation.
Whether you choose TIPs or breakevens depends on your view on where inflation goes next. TIPs are the conventional choice, but breakevens may be a better play if you believe people are underestimating just how high inflation could climb.
Energy stocks: Good proxy to US inflation breakevens
Why Lyxor for inflation
Lyxor has the most far reaching and complete range of inflation-linked ETFs in Europe, with exposures covering the US, Europe, and UK. Our Core US TIPS ETF is the cheapest on the market at just 0.09%. If you’re looking to not only protect yourself against rising inflation but also rising rates, our unique inflation expectations ETFs are designed to tackle both. With over 12 years’ experience managing inflation-related ETFs, and €3.3bn in AUM, look no further for dependable solutions to rising inflation.
Other ways to ride the inflation wave include investing in commodities, or targeting certain sectors. Our broad commodities ETF launched in 2006 tracks the Thomson Reuters/CRB index, a reference benchmark with over 50 years’ track record. It was the most widely traded broad commodities ETF in Europe over the past five years. We also offer 10 ways to access global equity sectors, with some of the oldest and largest ETFs of their kind in Europe. Our MSCI World Energy, Materials, and Financials ETFs were the most efficient in the market over the past year.*
*Source: Lyxor International Asset Management. Data as at 31/01/2018. Statements refer to European ETF market. Efficiency data is based on the efficiency indicator created by Lyxor’s research department in 2013. It examines 3 components of performance: tracking error, liquidity and spread purchase/sale. Each peer group includes the relevant Lyxor ETF share-class and the 4 largest ETF share-classes issued by other providers, representing market-share of at least 5% on the relative index. ETF sizes are considered as an average of AUM levels observed over the relevant time period. Detailed methodology may be found in the paper ‘Measuring Performance of Exchange Traded Funds’ by Marlène Hassine and Thierry Roncalli. Statements refer to European ETF market. Past performance is no guide to future returns.
This communication is intended for investors categorised either as “Eligible Counterparties” or “Professional Clients” within the meaning of Markets In Financial Instruments Directive 2004/39/EC.
All opinions/data sourced from Lyxor & SG Cross Asset Research teams. Opinions expressed are as at 05 January 2018.
THIS DOCUMENT IS DIRECTED AT PROFESSIONAL INVESTORS ONLY
This document is for the exclusive use of investors acting on their own account and categorised either as “Eligible Counterparties” or “Professional Clients” within the meaning of Markets In Financial Instruments Directive 2004/39/EC.
This document is of a commercial nature and not of a regulatory nature. This document does not constitute an offer, or an invitation to make an offer, from Société Générale, Lyxor International Asset Management or any of their respective affiliates or subsidiaries to purchase or sell the product referred to herein.
We recommend to investors who wish to obtain further information on their tax status that they seek assistance from their tax advisor. The attention of the investor is drawn to the fact that the net asset value stated in this document (as the case may be) cannot be used as a basis for subscriptions and/or redemptions. The market information displayed in this document is based on data at a given moment and may change from time to time. The figures relating to past performances refer or relate to past periods and are not a reliable indicator of future results. This also applies to historical market data. The potential return may be reduced by the effect of commissions, fees, taxes or other charges borne by the investor.
Lyxor International Asset Management (Lyxor ETF), société par actions simplifiée having its registered office at Tours Société Générale, 17 cours Valmy, 92800 Puteaux (France), 418 862 215 RCS Nanterre, is authorized and regulated by the Autorité des Marchés Financiers (AMF) under the UCITS Directive and the AIFM Directive (2011/31/EU). Lyxor ETF is represented in the UK by Lyxor Asset Management UK LLP, which is authorised and regulated by the Financial Conduct Authority in the UK under Registration Number 435658.
Lyxor International Asset Management (“LIAM”) or its employees may have or maintain business relationships with companies covered in its research reports. As a result, investors should be aware that LIAM and its employees may have a conflict of interest that could affect the objectivity of this report. Investors should consider this report as only a single factor in making their investment decision.
CONFLICTS OF INTEREST
This communication contains the views, opinions and recommendations of Lyxor International Asset Management (“LIAM”) Cross Asset and ETF research analysts and/or strategists. To the extent that this research contains trade ideas based on macro views of economic market conditions or relative value, it may differ from the fundamental Cross Asset and ETF Research opinions and recommendations contained in Cross Asset and ETF Research sector or company research reports and from the views and opinions of other departments of LIAM and its affiliates. Lyxor Cross Asset and ETF research analysts and/or strategists routinely consult with LIAM sales and portfolio management personnel regarding market information including, but not limited to, pricing, spread levels and trading activity of ETFs tracking equity, fixed income and commodity indices. Trading desks may trade, or have traded, as principal on the basis of the research analyst(s) views and reports. Lyxor has mandatory research policies and procedures that are reasonably designed to (i) ensure that purported facts in research reports are based on reliable information and (ii) to prevent improper selective or tiered dissemination of research reports. In addition, research analysts receive compensation based, in part, on the quality and accuracy of their analysis, client feedback, competitive factors and LIAM’s total revenues including revenues from management fees and investment advisory fees and distribution fees. Please see our investment recommendations disclosure website www.lyxoretf.com/compliance.