Adding or increasing an allocation to small-cap equities could help institutional investors achieve a few common goals, such as potentially helping boost near-term performance or improving diversification. Allocating to small caps could also help offset the potential reduction in expected return for liability-aware investors who are increasing fixed income in their portfolios to reduce risk.
There’s always a case for considering small caps, but right now may be a particularly compelling time to focus on the asset class. As the post-pandemic recovery continues, small caps are supported by economic dynamics and attractive relative valuations.
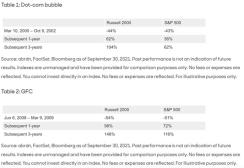
Small caps have historically performed well relative to their larger peers in the years following a recession. This is due to small caps’ more domestically oriented exposure and higher operational leverage, among other factors. Consider the dot-com bubble in the early 2000s. In the three-year period following that bear market, small caps1 outperformed large caps2 by 42%. A similar pattern played out following the 2008 global financial crisis (GFC). In the three-years following the GFC, small caps outperformed large caps by 32%.
While these past patterns don’t guarantee future performance, the 2020 pandemic-induced equity market drawdown isn’t unlike these two historical bear markets. Small caps today may be well positioned to turn in strong performance as economic recovery from the Covid pandemic continues. In fact, through the third quarter of this year, small-cap equities have outperformed their larger peers.

Small caps have lagged large caps since the spring of 2021, as market leadership has rotated away from cyclical, value-oriented areas toward more growth-oriented segments. This rotation has been prompted, in part, by concerns surrounding the economic recovery due to inflation and supply-chain challenges. Nonetheless, there is good reason to believe the cycle of small-cap outperformance is not over – rather, it may just be taking a breath.

For one, the prospects of an increase in infrastructure spending are likely to favor sectors more greatly represented among small caps, such as industrials, energy, and utilities. Further, companies today have amassed high levels of cash, which we feel will lead to, among other things, an increase in capital spending and M&A activity – both of which should favor smaller-cap stocks. As inflation and supply-chain issues work themselves out over time, helping to unleash further spending and investment, small caps are well positioned to potentially lead markets higher.
Favorable small-cap valuations
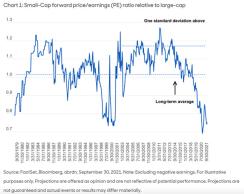
While economic dynamics support small caps, relative valuations for the asset class are also quite compelling. In fact, small caps are trading near their largest discount to large caps in 20 years. The small cap discount to large caps has grown over the past few years, in part due to the different sector compositions of the U.S. large- and small-cap indices.For example, the S&P 500 Index has a significantly higher weight to the information technology (IT) sector, a growth segment that has outperformed over the past several years. On the other hand, the Russell 2000 Index has a higher weight in the financials sector, a more value-oriented sector that has performed relatively poorly. Notably, after small caps reached a similar level of “cheapness” in early 2001, shares of smaller-cap companies materially outperformed those of large caps over the subsequent three-, five- and 10-year periods.3
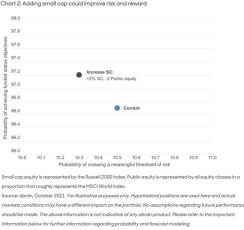
Modeling performed by abrdn suggests that moving a relatively modest 2% allocation away from other public equity into small cap could help improve both risk and reward metrics. In the view of abrdn, small-cap equity currently has an attractive expected return per unit of risk. In addition, small-cap stocks provide a diversification benefit since they are not perfectly correlated with other developed-market equities that typically have higher weightings within the portfolio.
Small cap and fixed income – an unlikely couple
Liability-aware investors who are at or near funded status might find particular utility in a small-cap allocation. It’s common for these investors, among others, to wish to reduce risk. A typical way to do this is to increase fixed-income exposure. But it’s also common to fear a reduction in the expected-return assumption as portfolios pivot toward greater fixed-income allocations. abrdn sees a combined, complementary allocation to both fixed income and small caps as a potential solution to this problem.Increasing small-cap equity exposure alongside fixed income could help mitigate the negative impact on expected return that this low-risk fixed-income investment could have.
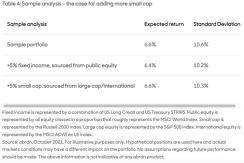
abrdn’s current, 10-year return expectation for small-cap equities is 11%, compared to 6.4% for large caps. The high return expectation for small caps could offset the drag fixed-income investments may have on the portfolio, potentially providing a very comfortable complement to a portfolio otherwise dominated by large caps. These two asset classes may make an unlikely pair, but they could potentially solve for the conundrum of reducing risk without reducing expected return.
1 As represented by the Russell 2000 Index
2 As represented by the S&P 500 Index
3 At January 31, 2001, the forward P/E for the Russell 2000 relative to the Russell 1000 reached a trough of 0.73. Over the subsequent 3-, 5-, and 10-year periods, the Russell 2000 returned 19.0% (vs. -13.1% for S&P 500), 53.8% (vs. 1.9% for S&P 500) and 75.2% (vs. 13.8% for S&P 500). Source: FactSet
FOR PROFESSIONAL INVESTORS ONLY.
NOT FOR USE BY RETAIL INVESTORS.
Issued by a member of abrdn group, which comprises abrdn plc and its subsidiaries.
Hypothetical portfolio performance is not an indicator of future actual results. There can be no guarantee that any assumptions or projections used herein will be met. abrdn often uses forecasting and projection modeling to help derive estimated returns as well as volatility in connection with it portfolio design and investment management processes. No projection or forecast can offer a precise estimate of future returns or volatility in global asset classes or markets. Forecasts are inherently uncertain, subject to change at any time based on a variety of factors and can be inaccurate. abrdn believes that the benefit of this information is highest in evaluating the potential risk adjusted return of various components of a globally diversified portfolio. The projections or other information contained in this document regarding the likelihood of various investment risk and return outcomes are hypothetical in nature, do not reflect actual investment results and are not guarantees of future results. Information provided for illustrative purposes only; is not indicative of any abrdn product; and no inference is made regarding future performance and/or investment outcomes.
abrdn’s forecast modeling incorporates both proprietary and third party tools to derive a risk and return data for each asset class listed. Our forecasts and projections are informed by history while making forward looking assumptions. We make use of economic forecasts, implied market views and assumptions about historical trends and mean reversion over several time horizons. We use various macroeconomic and asset-class specific variables as inputs. In attempting to forecast expected returns and volatility, we apply a Monte Carlo simulation method to project the estimated volatility. This enables us to create 10,000 scenarios, from which we derive realistic probability distributions for returns, and from which asset class volatility can be derived. Results produced by the forecasting tool will change with each use and over time. Further information regarding our forecast modeling can be delivered upon request.
Projections are offered as opinion and are not reflective of potential performance. Projections are not guaranteed and actual events or results may differ materially.
Diversification does not ensure a profit or protect against a loss in a declining market.
Fixed income securities are subject to certain risks including, but not limited to: interest rate (changes in interest rates may cause a decline in the market value of an investment), credit (changes in the financial condition of the issuer, borrower, counterparty, or underlying collateral), prepayment (debt issuers may repay or refinance their loans or obligations earlier than anticipated), call (some bonds allow the issuer to call a bond for redemption before it matures), and extension (principal repayments may not occur as quickly as anticipated, causing the expected maturity of a security to increase).
Equity stocks of small and mid-cap companies carry greater risk, and more volatility than equity stocks of larger, more established companies.
Indexes are unmanaged and have been provided for comparison purposes only. No fees or expenses are reflected. You cannot invest directly in an index.
US-191121-161311-1