One of Lyxor’s key calls in our Q2 outlook was that the road ahead may not be as smooth as it has been for US assets. For all that, economic growth still looks firm – consumption remains the strongest driver, backed by continued consumer optimism and substantial wage gains. The current expansionary phase will soon become the joint second-longest in the country’s history. Should it endure to next spring, it would be the longest ever. At the moment, however, it is showing signs of wear and tear.
Inflation is on the rise, so real consumption is outstripping income. The household savings rate has halved over the last couple of years, while rising delinquency rates for auto loans suggest early signs of consumer stress. Slower job growth and lower rates of savings mean the recent tax cuts could be crucial – without them Trump’s bid to keep growth on trend may be doomed to failure. The question is whether they have gone far enough.
Fiscal push or fiscal nudge?
Tax reforms in the US included a new corporate tax rate of 21%, the repeal of the corporate alternative minimum tax, and full expensing of equipment for the next five years. The recent budget deal added further stimulus through federal spending. The amount likely to be injected into the US economy should exceed 1% of GDP each year. Yet, at this late stage of the cycle, the scale of the measures may not be entirely reflected in real activity. Overall, the fiscal push should add around 0.5% to growth this year – meaning a rate of around 2.75% by year end.
Whatever its real effects, it’s still an unprecedentedly large package at such a late stage of the cycle, and there’s no doubt it will spur on inflation in our view. A tight labour market should push wage inflation past the 3% mark within months. This wave will eventually wash through inflation prints to the benefit of US breakevens.
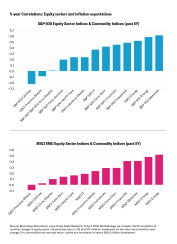
Equities are often viewed as being capable of hedging inflation – which has proven true, especially over longer timeframes and periods of moderate inflation. The view doesn’t always stand up to scrutiny over shorter periods of time however, especially when inflation is at extreme levels. In fact, our analysis shows equities do not outperform in these conditions.
Should investors dig deeper, they may find equity sectors like gold miners, oil, materials, and financials, along with factors like value and yield are more correlated to inflation expectations and CPI, and therefore more capable of riding the rise. Be wary, however, of their utilities, telecoms, and consumer staples counterparts.

5-year Correlations: Equity sectors and inflation expectations
The fear of four
The exceptional conditions that have artificially suppressed yields since the Global Financial Crisis should continue to fade. We’ve long expected at least three rate hikes from the Fed in 2018, and now believe the possibility of four 25 basis point hikes is much greater than it was. Tighter policy normalisation cannot be ruled out. We suspect 10-year Treasury yields will push some way past 3%, so we are underweight over the long term. Shorter-term however, they retain their safe haven appeal should risk aversion spike.
How far from here?
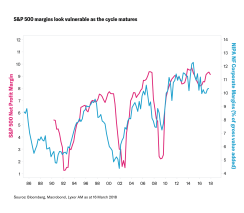
The firmer wage growth at this late stage of the expansion is likely to dent corporate profitability. Margins could compress by about 0.5% per year, although the positive effects of tax reform will help to mitigate this to some degree. All told we expect solid earnings-per-share growth of around 9% this year but rather more sedate results next year as the cycle totters into its dotage. There may therefore only be limited upside for the mainstream indices like the S&P 500 Index from here – only products offering the lowest cost access, or the very best performance, may merit consideration.
Trading insults, rather than ideas
Greater consumer spending may encourage more imports as US capacity constraints bite. Any widening of the trade deficit could add further political pressure to Trump’s tightwire trade agenda. The heady rhetoric and bouts of brinkmanship seem more negotiating tactics than they are a declaration of trade war or a U-turn on globalisation, not least because of looming mid-term elections. In our view, Trump won’t risk blowing up a bull market – one of few feelgood factors at his disposal – at such a time.
Q2 positioning
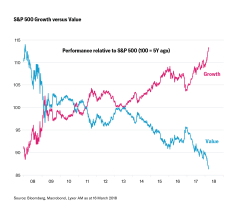
We still expect US equities to outperform bonds in Q2, albeit by a lesser margin than before. That said, the President’s taste for battle may rattle some of the country’s more risk-averse trading partners. Expect outward-looking international firms to suffer more than their domestic-focused counterparts. As a result, we’re neutral on the outlook for the broader indices and our preference is to invest in certain themes, like favouring growth over value, and sectors. Take capex, for example. Tax reform should help accelerate spending on non-residential investments and in technology, a sector representing 30% of current capex and around 35% of the S&P 500 Growth Index. Despite all the talk of a new tech bubble, valuations look merely stretched in places rather than speculative or bubbly.
Our one value-based call remains banks because of the sector’s cyclicality. Commercial and industrial loans look likely to rebound, which will boost profitability. Higher inflation expectations also tend to translate into better prospects. The Fed’s continued willingness to simplify regulation is the last of a powerful trio of clearly positive catalysts.
In fixed income, away from our views on breakevens and treasuries, we’ve yet to really touch on credit. In our view, the picture is fairly bleak – especially for high yield because valuations appear high and the sector appears to be pricing in a growth rate far in excess of what’s likely to eventuate in 2018. Leverage levels and inherent illiquidity are also a concern.
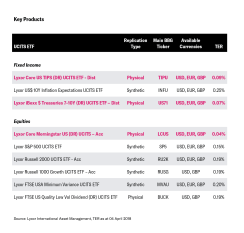
Why choose Lyxor for US assets?
Whatever you’re seeking to do in your US-related portfolio, we believe we can help. We offer 15+ routes to the market including Europe’s lowest-cost Core US equity ETF at just 0.04%, as well as the best-performing S&P 500 ETF your money can buy. So, if the upside is limited, you get to make the most of the opportunity. You can also generate income with the cheapest quality income ETF on the European market or take out some insurance against the possibility of renewed volatility with our minimum variance product – which has reduced risk by nearly 18% since its inception. It’s also the most diverse of its kind.
We’re not just equity experts though. We also offer the cheapest US Treasuries, US corporate bond and US HY bond ETFs on the market – among them some of the best-performing and most efficient you’ll find. You’ll also be able to adjust to the changing inflation picture with our US TIPS ETF and our unique US inflation expectations product.*
This communication is intended for investors categorised either as “Eligible Counterparties” or “Professional Clients” within the meaning of Markets In Financial Instruments Directive 2004/39/EC.
THIS DOCUMENT IS DIRECTED AT PROFESSIONAL INVESTORS ONLY
This document is for the exclusive use of investors acting on their own account and categorised either as “Eligible Counterparties” or “Professional Clients” within the meaning of Markets In Financial Instruments Directive 2004/39/EC.
This document is of a commercial nature and not of a regulatory nature. This document does not constitute an offer, or an invitation to make an offer, from Société Générale, Lyxor International Asset Management or any of their respective affiliates or subsidiaries to purchase or sell the product referred to herein.
We recommend to investors who wish to obtain further information on their tax status that they seek assistance from their tax advisor. The attention of the investor is drawn to the fact that the net asset value stated in this document (as the case may be) cannot be used as a basis for subscriptions and/or redemptions. The market information displayed in this document is based on data at a given moment and may change from time to time. The figures relating to past performances refer or relate to past periods and are not a reliable indicator of future results. This also applies to historical market data. The potential return may be reduced by the effect of commissions, fees, taxes or other charges borne by the investor.
Lyxor International Asset Management (Lyxor ETF), société par actions simplifiée having its registered office at Tours Société Générale, 17 cours Valmy, 92800 Puteaux (France), 418 862 215 RCS Nanterre, is authorized and regulated by the Autorité des Marchés Financiers (AMF) under the UCITS Directive and the AIFM Directive (2011/31/EU). Lyxor ETF is represented in the UK by Lyxor Asset Management UK LLP, which is authorised and regulated by the Financial Conduct Authority in the UK under Registration Number 435658.
Lyxor International Asset Management (“LIAM”) or its employees may have or maintain business relationships with companies covered in its research reports. As a result, investors should be aware that LIAM and its employees may have a conflict of interest that could affect the objectivity of this report. Investors should consider this report as only a single factor in making their investment decision.