By Erik Norland, CME Group
AT A GLANCE
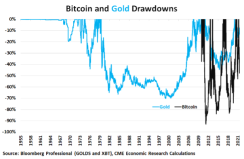
- Bitcoin has experienced three larger declines than the two 50%+ bear markets that have occurred over the previous year
- A single data series saw a spike in the months prior to each of bitcoin’s previous declines
Does a little-known data series hold the key to understanding what triggers bitcoin bull markets and bear markets? While bitcoin prices have soared from a few cents to as high as $69,000 per coin, its upward path hasn’t always been smooth.
In addition to its two 50% plus bear markets in the past 12 months, bitcoin has experienced three even larger declines:
- Between June and November 2011, it fell 93%
- It had an 83% decline between November 2013 and January 2015
- And it fell 84% between December 2017 and December 2018
All these declines had one thing in common: a sharp rise in miners’ revenue per transaction. Miners are paid to verify trades on the blockchain and their fees for doing so change over time. The time series that measures this phenomenon is available for free on the website blockchain.info/charts where miners’ revenue per transaction is referred to simply as “cost per transaction.”
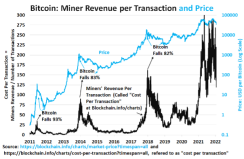
In the months before each of the past bitcoin bear markets, the miners’ fees rose sharply, sometimes increasing ten-fold or more. By contrast, miners’ revenue per transaction tended to fall and to remain stable at low levels in the months before bitcoin bull markets.

Read more articles like this at OpenMarkets