A re-evaluation of essential real estate markets.
Over the past decade, real estate markets have transformed significantly, leading to a redefinition of market categorizations. Institutional investors like pensions and sovereign wealth funds often use two common categorizations of commercial real estate investing — core markets and gateway markets — to understand where the most liquid, transparent, and expected stable returns lie. These definitions helped investors differentiate risk levels, but over the last 10-20 years, their meanings have evolved as the markets transformed.
The ”core” property type nomenclature was partially an extension of more established investment strategies where core referred to low risk/return strategies — and opportunistic to higher risk/return strategies. The “gateway” markets, although there is no formal definition, came to mean markets that are most transparent, have a history of stable returns, and offer the most liquidity.
These terms were not meant to imply the best returns; investors can find higher returns in less liquid and less transparent markets. However, these categories help investors define and target markets that align with their investment goals. This has given investors the power to better evaluate and rank what the lowest risk and most transparent property types and markets are.
Core Real Estate Markets
In the 1980s, core property types included office, industrial, and malls. By the early 1990s, apartments were also included. Gateway markets have included New York, Boston, Washington D.C., Chicago, San Francisco and Los Angeles. Although these property types and markets arguably had the largest available investment pools, there wasn’t enough information at the time for investors to understand if they were necessarily the lowest risk.
Today, the commercial real estate world is very different, with organizations like the National Council of Real Estate Investment Fiduciaries (NCREIF), the Commercial Real Estate Finance Council (CREFC) and the National Association of Real Estate Investment Trusts (NAREIT) offering decades of standardized performance information across many segments of commercial real estate. As transparency in commercial real estate performance improves, MetLife Investment Management suggests refreshing these definitions every five to ten years.
Redefining and Ranking Gateway Markets
Despite a general consensus on gateway markets, there has never been an authoritative definition of what qualifies as a gateway market. One often cited characteristic includes the size of the market, as measured by population or real estate transaction volume, and MIM believes this may have been the primary characteristic as the terminology was formalized 30 years ago.
Another characteristic is a location that international investors frequently visit, benefiting cities like San Francisco but disadvantaging others like Houston. Another may include the historical stability of the local economy. Despite the lack of a consensus methodology, there are generally accepted U.S. gateway markets, which include Boston, New York, Washington D.C., Los Angeles, San Francisco and Chicago. 1
One consensus is that gateway markets should be defined as the markets that are the most transparent, have a history of stable returns and offer the most liquidity. Transparency and liquidity are perhaps aligned with existing notions of what a gateway market should be, while the addition of stability may or may not be.
To identify markets with the highest transparency, return stability, and liquidity, we rank them using five subcategories outlined below..
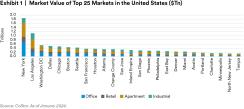
1. Market size. To support the goal of transparency, MIM examines the commercial real estate asset value estimates for each of the top 25 markets in the United States, which is shown in Exhibit 1. Although this is just a single measure, MIM believes it is an effective proxy for other factors that could be relevant such as an MSAs population, economic size or transaction volume. Using equities as an analogy, the S&P 500® Index is comprised of the stocks of the largest 500 publicly traded companies in the United States, and this exercise ranks the top 25 commercial real estate markets in the United States.
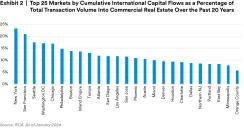
2. International capital is an indication of the global stature of a city and can help to define a gateway market. Also, the presence of international capital indicates more depth of buyers and sellers and enhanced liquidity. In Exhibit 2, we rank the top 25 markets based on the amount of international capital as a percentage of total transaction volume since Real Capital Analytic estimates were first available 21 years ago.
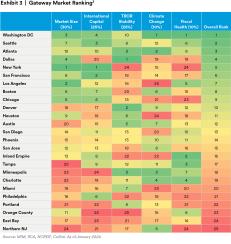
3. Total rate of return stability is another key element of this analysis. Gateway markets are typically thought to be more stable with lower cap rates. However, lower cap rates do not always accurately reflect the size or stability of the market at present. We used NCREIF NPI2 total return data over the past 20 years to stratify markets by price stability (lowest standard deviations of returns). While larger markets are considered to be more stable, our analysis doesn’t conclude this. As a result, we believe that 10-year expected population growth rates are positively correlated with total rate of return stability and encapsulate demographic shifts in each market, and incorporate these forecasts into our market stability ranking.
4. Climate change is making future commercial real estate returns less predictable in some markets. Real estate owners face risks from climate change in the form of physical risk as well as the transition to a low-carbon economy. Transition risk includes federal and local legislation and regulations. Rising physical risks, such as storms, wildfires, drought, flooding and storm surge can all have impacts on the viability of commercial real estate investments, even if the impact is only to the surrounding community and not to the actual asset.
5. Fiscal health could be important for U.S. markets today, with many markets reaching stress levels as a result of expanding debt and limited or negative population growth. Markets with strong fiscal health likely have a better ability to respond to climate risks, grow needed infrastructure, and keep property taxes stable.
These five factors and subsequent scores are outlined in Exhibit 3. The weights are 25% Market Volatility, 25% International Capital, 30% Market Size, 10% Climate Change, 10% Fiscal Health.
Finally, MIM does not always recommend overweighting investments in gateway markets. Indeed, investors with a greater risk tolerance, and investors who view market selection as a way to add alpha, may want to actively avoid the lower and more stable returns generally offered in gateway market real estate.
Defining Core Property Types
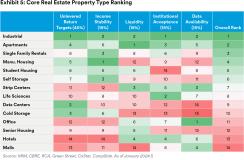
Similar to gateway markets, what was true 30 years ago is not necessarily true today. Due to the maturation of the commercial real estate sector, MIM believes that there should be more than just four core property types. Their methodology follows that core property types should generally be those that offer the most transparency and that have the most stable returns. Using five measurements to help evaluate the new core property types, the weights for each variable are as follows: 40% unlevered return targets, 15% income stability, 15% liquidity, 15% institutional acceptance, 15% data availability.
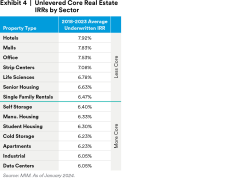
Unlevered return targets: MIM believes lower-return targets are partially a function of how investors view the outlook for risk across the various property types, with lower-return targets indicating less of a risk premium.
Exhibit 4, shows unlevered return targets.
Liquidity: Each sector is ranked based on the ability to buy and sell $250 million.
Institutional acceptance is based on the historical role that institutions have played in each of the sectors.
Data availability was evaluated by considering major real estate data providers, as well as professional judgement to evaluate what types of datasets and industry organizations still need to emerge in order to give similar levels of confidence across each sector.
Exhibit 5, shows the results of MIM’s core property type ranking.
Conclusion
Despite the seemingly slow-moving nature of real estate, the investment universe is ever-evolving and can do so rapidly. MIM’s analysis demonstrates that many of the markets and property types long considered gateway or core should evolve as well. Investors should consider that core investments can exist in cities and property types further down the list, such as a newly constructed and well-leased market-dominant mall or a LEED Platinum office building with more than 10 years of term remaining on leases to growing investment-grade tenants. As with all real estate analyses, property-level evaluations trump all.
[1] The Risk and Reward of Investing in Secondary Markets - Urban Land Magazine (uli.org)
2 The NCREIF Property Index (NPI) measures the performance of real estate investments on a quarterly basis.
3 Weights for each variable are as follows: 25% Market Volatility, 25% International Capital, 30% Market Size, 10% Climate Change,
10% Fiscal Health. Market volatility is 50% based on the standard deviation of returns as tracked by NPI from 2000-2022, and
50% based on 10-year projected population growth as tracked by Moody’s. International Capital is based on transaction volume
averages non-U.S. investors between 2000 and 2021 as tracked by MSCI’s RCA divided by the total transaction volume. Market
Size is based on CoStar’s total commercial real estate market value.
Learn more about MetLife Investment Management
This article presents the authors’ opinions reflecting current market conditions. It has been prepared for informational and educational purposes only and should not be considered as investment advice or as a recommendation of any particular security, strategy or investment product. This article has been sponsored by and prepared in conjunction MetLife Investment Management, LLC (formerly, MetLife Investment Advisors, LLC), a U.S. Securities Exchange Commission-registered investment adviser. MetLife Investment Management, LLC is a subsidiary of MetLife, Inc. solely for informational purposes and does not constitute a recommendation regarding any investments or the provision of any investment advice, or constitute or form part of any advertisement of, offer for sale or subscription of, solicitation or invitation of any offer or recommendation to purchase or subscribe for any investments or investment advisory services. Subsequent developments may materially affect the information contained in this article. Affiliates of MIM may perform services for, solicit business from, hold long or short positions in, or otherwise be interested in the investments (including derivatives) of any company mentioned herein. This article may contain forward-looking statements, as well as predictions, projections and forecasts of the economy or economic trends of the markets, which are not necessarily indicative of the future. Any or all forward-looking statements may turn out to be wrong. All investments involve risks including the potential for loss of principal.
L0724041676[exp0726][All States]


