Scott Bauer, for CME Group
AT A GLANCE:
- Average daily volume in 10-Year U.S. Treasury Note futures rose 24% from January 2023 to January 2024
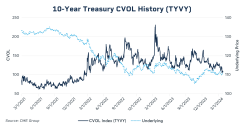
- The CME Group Volatility Index (CVOL) for the 10-Year contract is reflecting the market’s uncertainty around bond markets and interest rates
Bond market volatility over the last three years has been historic. Now that it has leveled off a bit, what might lie ahead? A few months ago, traders and the market were pricing in as many as six rate cuts – approximately 140 basis points – this year, while the Federal Reserve was pricing in three – around 75 basis points. Now, the CME FedWatch Tool indicates they are in line with one another.
What Caused Recent Volatility?
As rates fall, bond prices rise because it is worth more to hold the rights to bond repayments based on their higher rates. At the beginning of the pandemic, bond prices soared as traders and investors were searching for yield. Not only did prices rise sharply but so did treasury volatility.
What caused this volatility? Uncertainty. The market, regardless of equity or fixed income, does not like uncertainty. Going from a period of dramatic easing to almost unprecedented tightening in such a short period of time will do that as the Fed kept traders and investors alike on their toes.
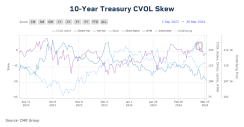
CME Group Volatility Index (CVOL) Skew

Recent futures and options price action across CME Group Treasury products show why using the CME Group Volatility Index (CVOL) can be a helpful tool. CVOL measures 30-day forward looking implied volatility and incorporates every strike on the implied volatility curve, not just at-the-money strikes. CVOL skew shows the relationship between a put and a call option with the same out of the money delta. This skew expresses a view of the cost of downside protection versus upside protection.
The 10-year U.S. Treasury Note is one of the most closely watched benchmarks in the world. It is not only a barometer for investor confidence but is a proxy for many other yields, such as mortgage rates.
Looking at the skew in the 10-year over the last six months is representative of the uncertainty of the bond markets and where interest rates may be headed.
The uncertainty of inflation, the labor market and the global economy is sure to keep volatility at the forefront of the treasury market for the foreseeable future.