Adila McHich and Paul Wightman, CME Group
AT A GLANCE
- Trading volume in Henry Hub natural gas futures and LNG freight futures grew sharply in 2023 as more U.S. gas was shipped to Europe.
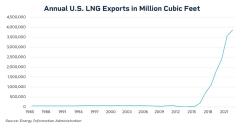
- The U.S. exported around 90 million metric tons of LNG in 2023, making it the world’s largest LNG exporter.
U.S. liquefied natural gas (LNG) exports soared to record highs in 2023, capturing a growing share of the European market. Meanwhile, unseasonable weather across the U.S. in early 2024 added to market volatility.
Trading volume and open interest in Henry Hub natural gas futures also grew sharply last year, while open interest in LNG freight futures for shipments from the U.S. Gulf to Europe rose to their highest level since the contract was launched in late 2019.
The surge in trading activity is being driven by a combination of factors including winter demand shaped by the El Nino weather pattern, and supply imbalances. In addition, the growing integration of natural gas markets globally has increased the need to hedge LNG and freight.
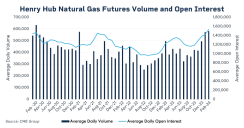
Increased hedging is driving trading activity in Henry Hub natural gas futures
The average daily volume (ADV) of Henry Hub futures was approximately 406,809 contracts in 2023, an increase of 19% from the previous year. Year-to-date (YTD) ADV has already reached 626,789 contracts as market participants continue to manage risk this year. Open interest (OI), or the number of unsettled futures contracts, averaged 1,249,189 in 2023, up 19% from 2022, while OI has averaged 1,399,558 contracts YTD.
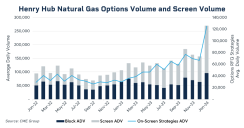
Trading in options is also experiencing strong growth. Screen-traded volume continues to break records, with an ADV of 185,000 contracts, while total volume of block trades on screen had a record month in January with 293,000 ADV.

Managing Freight Costs
The U.S exported record volumes of LNG in 2023, a trend that looks to continue in 2024 as global gas markets continue to readjust from the loss of Russian supplies following sanctions due to its war with Ukraine. The higher exports have driven greater hedging volumes in the LNG freight markets as traders look to manage risk in an increasingly volatile market. Higher shipments of U.S. LNG have altered Europe’s energy supply mix. The share of Russian pipeline gas as a portion of total EU energy imports fell from 41% in 2021 to 8% in 2023.
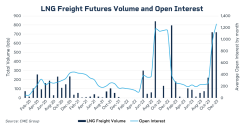
The transportation costs for the increased gas flows are being hedged in the futures markets. Open interest in the NYMEX contract for LNG freight from the U.S. Gulf to Europe has reached the highest level since the contract was launched. A set of three new futures contracts were launched in January 2024 based on a more efficient LNG vessel with a capacity of 174,000m³. The new vessels use more advanced engine technology, and the LNG bunker fuel is processed using a lower boil off rate which helps to reduce overall greenhouse gas emissions.
Open Interest in LNG freight sets new highs
Henry Hub volatility spiked with cold snap
Henry Hub natural gas front-month prices have been generally weak due to mild weather conditions and record high production. However, January prices gained 5% compared to December 2023 as a January Arctic blast sent temperatures plummeting across the U.S. and Canada, pushing natural gas consumption to a new daily record high of 141.5 billion cubic feet (Bcf) on January 16. Uncertainty in the weather led volatility to spike to 99%, based on the CME Group Volatility Index (CVOL). The tool measures the expected implied volatility from options prices based on the collective market sentiment of future price moves.
Volatility in the LNG freight market is a frequent occurrence with rates impacted by short-term supply and demand factors in both the natural gas market and the availability of shipping. Looking at the volatility in the key U.S Gulf to Europe route, levels have fluctuated on a consistent basis. Typically, when there is higher volatility in a market, it will tend to prompt traders to hedge greater volumes via the futures markets. CME group data shows that the 30-day standard historical annualized volatility levels have been as high as 250% and as low as 50% in recent months.
U.S Energy Information Administration (EIA) data shows that the U.S. became the world’s largest exporter of LNG, outpacing exports from Qatar and Australia. The U.S. exported around 90 million metric tons (MT) of LNG in 2023, which was around 15% higher than volumes exported in 2022. Part of the reason for the higher volumes was a return to full production for the Freeport LNG plant on the U.S Gulf Coast following an outage in 2022.
New Headwind for U.S. Supply?
In January 2024, the U.S government announced a pause on new licenses for export terminals. It is not clear what impact there may be on U.S. supply given the amount the U.S currently produces and with further projects already approved and slated to come onstream before 2030. Wood Mackenzie’s analysis suggests that LNG production volumes are enough to meet the combined gas requirements for Germany and France from existing production.
The freight markets are expected to remain volatile in the coming months with prices fluctuating on a day-to-day basis. Natural gas demand is expected to remain strong in the European markets as the region continues to deal with the fallout from reduced Russian natural gas flows. These factors will be worth watching in the months ahead as market participants navigate the near constant changes.