Over the past couple of years, public markets have endured significant volatility. As investors navigated an unstable geopolitical environment, inflationary pressures and rising interest rates, public markets have see-sawed. In the first three quarters of 2022, the S&P 500 declined by 25%. Meanwhile private equity declined by only 5%, according to Burgiss.
This opened up the age-old debate around private equity valuations. Many market pundits claimed that private equity valuations were irrational and opaque. In fact, in many instances of market turbulence where public markets decline and private equity does not follow suit, this narrative reappears: “Why don’t private valuations move in lock step with declining public markets?”
We dug into this question and our conclusions are quite the opposite. Our analysis suggests it is public markets rather than private equity that are irrational. In fact, we would argue that through historical bouts of market volatility, private equity has acted very rationally.
We want to be clear, we are focused on buyout valuation not venture capital or growth.
Inherent Private Equity Buffer
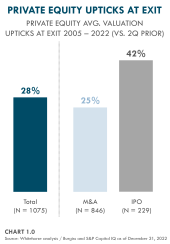
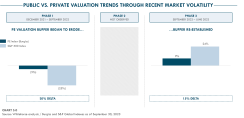
Based on our discussions with the market, many experts in private equity estimate between 15-30%. We decided to test this theory. We combed through nearly two decades of data covering 1,075 private equity exits across North America and Europe from 2005 to 2022. Our analysis found the exit value of a private equity owned company was, on average, 28% higher than the valuation two quarters prior.
This would suggest that private equity firms are in fact, undervaluing companies, not overvaluing them. We refer to this as the “valuation buffer”.

Looking closer, when sold through M&A, the pop is on average 25%, and when sold through an IPO it rises to 42%. See Chart 1.0.
Valuation Buffer Over Time
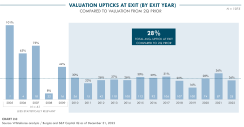
Some may ask: “Is that pop skewed by outlier years?” So we looked at the data by year and can see that since 2010 it has been consistently in the 25-30% range, demonstrating that private equity is undervalued throughout market cycles. See Chart 2.0.
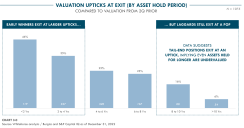
Skeptics may also speculate that companies held for a long time must be underperforming assets that need to be sold at discounts.
Our analysis shows that while there is a greater pop for companies exited quickly (the “winners” in the portfolio), the laggards still exit, on average, at a pop. Companies held for less than two years, exit on average, at a 46% mark-up, while companies held for longer than 10 years still exit, on average, at a 6% pop.
Said differently, while laggards exit at less of a pop, they still exit at a pop suggesting even the laggards are undervalued.
Therefore, our analysis indicates that private equity, on average, consistently undervalues its portfolios in good times and bad both for the winners and laggards; in our view, this happens consistently, predictably and rationally. See Chart 3.0.
Looking Back at the Global Financial Crisis
It is also important to analyze what happens to the valuation buffer during times of volatility, particularly through an entire cycle. We focused on the Global Financial Crisis (GFC) as a test case for how private equity interacted with public markets.
What we found was that in the first phase of a public market decline, private equity declines are more muted as the valuation buffer erodes. After the buffer has evaporated, private equity valuations start to decline in unison with public markets. On the recovery, public markets valuations rebound more quickly than private equity as the buffer gets re-established.
Interestingly, we find that those concerned about private equity valuations tend to overemphasize the narrative that private equity does not follow public markets on the decline, but they fail to report when private equity valuations lag public markets on the recovery.
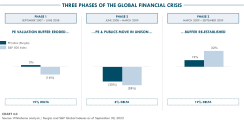
Consider the most significant economic downturn since the Great Depression, the Global Financial Crisis of 2007-2009. The market went through a number of stages:
Phase 1: In September 2007 to June 2008, public equity markets began a steady decline, as the sub-prime mortgage crisis gripped Wall Street and banks around the world faltered. From September 2007 to June 2008 the S&P 500 was down 16%.
Over that same period, private equity valuations were up 3% - a delta of 19% compared to the S&P 500. Some market pundits declared private equity valuations as irrational, opaque and irresponsible. However, is it possible that private equity was just eroding its valuation buffer in the first phase of this decline?
Phase 2: From June 2008 to March 2009, the S&P 500 declined by 38%, driven by the failure of Lehman Brothers, the government takeover of Fannie Mae and Freddie Mac, and the resulting shockwaves to the global financial system. Private equity declined 30% over the same period, we believe demonstrating that once the buffer had eroded in Phase 1, private equity started to decline in unison with public markets.
Phase 3: Between March 2009 and September 2009 of the GFC, the S&P 500 was up 32% while private equity’s recovery was more muted at 13%. During this phase, we would suggest the valuation buffer was being re-established. As private equity lagged the public market recovery, many of the same market pundits who expressed concern about the lack of decline in private equity in Phase 1 were silent when public markets raced far beyond private equity’s recovery. See Chart 4.0.
Comparing Recent Market Trends to the GFC
With that context, we focused on the most recent bout of volatility. We asked ourselves how the 2022-2023 market volatility compared to the GFC.
Our analysis was sparked by criticism from market pundits in the first three quarters of 2022. As public markets declined by 25% and private equity declined by only 5%, the narrative of private equity valuations being opaque and irrational returned.
What we saw was a private equity market that behaved very consistently to the GFC. What we saw was predictable behaviour. What we saw was a rational private equity market whilst the public markets were exhibiting signs of irrationality.
Case in point: from December 2021 to September 2022, public markets were down 25% and private equity was only down 5%. A delta of 20%. Essentially the same delta that we witnessed during Phase 1 of the GFC.
By September 30, 2022, the valuation buffer had largely eroded, as can be seen in Chart 5.0. Had markets declined more than 20%, it is our thesis that private equity would have likely followed. But that was not the case.
In September 2022, public markets began to rebound. In fact, from September 2022 to June 2023, public markets were up 24% and private equity was up 9%. In spite of this, private equity valuations were not considered conservative by market commentators at the time – those commentators were silent.
Our conclusion: Private equity valuations are only put into question when they don’t follow public market declines. The topic is rarely broached when public markets recover more quickly than private equity. We believe it is a one-sided conversation. From September 2022 to June 2023, the valuation buffer in private equity was quietly re-established as it similarly happened from March to September 2009.
Private Markets Remain Stable during Public Market Volatility
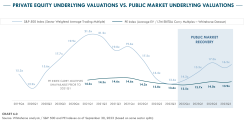
Throughout the market turbulence from 2021 to 2023, we witnessed sector-weighted public market valuations of the S&P 500 swing from 13.5x to 21.5x EV/EBITDA. During this same period, private equity valuations stayed within a very narrow band of 13.6x to 14.6x. In Chart 6.0, it is clear that public market valuations during this period moved considerably more than those in private markets, inviting the question: which were more rational?In fact, we can see that S&P 500 and private equity valuations converged in September 30, 2022 at 13.6x. Had the S&P 500 declined further from its 3,583 trough, we believe private equity would have declined in unison. This would have been the beginning of Phase 2 in this cycle.
In reality, this did not happen. In the 2022/23 cycle, we skipped Phase 2. The S&P 500 bounced back, up 24% in three quarters. Meanwhile, private equity valuations were more muted, up 9% during this same period, as the buffer got reestablished. See Chart 6.0.
2023 Buffer Reconciled
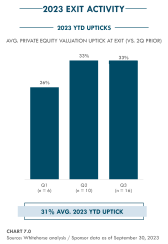
To test our theory that the public market recovery had in fact re-established the buffer in private equity, we looked at all exits in 2023 in our database and the pop they experienced. Of the 32 exits, the average pop at exit was 31%.This reinforces our conclusion that private equity remains conservatively valued despite public market turbulence.
As described above, private equity values remain at a discount – not a premium – to public markets. See Chart 7.0.
S&P 500 Secondary Value
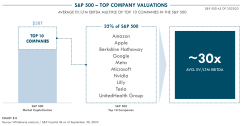
One final piece of analysis – we looked at the composition and current value of the S&P 500. It has been well documented that the index is heavily exposed to its top 10 assets. In fact, these 10 assets represent 32% of the index and are valued at about 30x EBITDA as of September 30, 2023.In the secondary market, we consider what pricing a concentrated portfolio with its top 10 holdings being valued at an average 30x EBITDA would get as a discount to their net asset value.
Based on what we are seeing, we believe industry participants would likely agree it would be in the low 70s of net asset value. This means most private equity secondaries would require at least a 20% or more discount to generate liquidity on the S&P 500. See Chart 8.0.
Final Thoughts
Our analysis leads us to a few important conclusions.
Firstly, private equity owned companies are generally held at a discount, not a premium, to their public market equivalents in normalized economic environments. We believe this is evidenced by a consistent pop at exit, or the valuation buffer.
Second, in periods of downside volatility, the valuation buffer erodes in the first phase of the public markets decline. This has been a pattern in prior cycles. It is our view that only once the valuation buffer is fully eroded, does private equity begin to decline in unison with public markets.
Third, the significant valuation swings in public markets and the relative stability in private equity through volatility suggests that private equity is more rational and not nearly as opaque as some would suggest.
To be clear, we are not justifying all private equity valuations. There will undoubtedly be examples or evidence that some companies in private equity are overvalued. However, our analysis suggests that, on average, private equity has shown restraint relative to public markets.
Learn more about Whitehorse Liquidity Partners.
Legal Disclaimer: Based upon Whitehorse Liquidity Partner’s current views informed by published sources and third parties and no assurance can be made that historical trends will continue. Burgiss and S&P Capital IQ data in the first three charts represent all available data within certain criteria (excluding outlier data points), including geography, fund size and strategy. PE Index in sixth chart includes all 188 companies proactively priced by sponsor where EV/EBITDA is the relevant valuation metric and data is available. Sponsor data in seventh chart represents all 2023 private equity exits of funds proactively priced by sponsor where data is available.