To update a well-traveled quip by former U.S. senator Everett Dirksen, $10 billion here and $10 billion there, and soon you’re talking about a stock buyback program at Apple. In 2014 alone, Apple spent an astounding $45 billion to buy back shares, about half the Cupertino, California, company’s current buyback authorization. The slated buyback program, at $90 billion, exceeds the annual spending of all but ten states in the U.S.
“We’re confident in Apple’s future and see tremendous value in Apple’s stock,” said CEO Tim Cook last April. “So we’re continuing to allocate the majority of our program to share repurchases.”
So far, so good, according to the most recent Corporate Buyback Scorecard, for the fourth quarter of 2014, designed and calculated for Institutional Investor by Fortuna Advisors. Released quarterly, Corporate Buyback Scorecards reflect share repurchases over a rolling two-year period.
Apple was pressured by activist investor Carl Icahn, who began lobbying for a substantial buyback program at the tech giant in 2013. Since then, Apple has risen steadily in the buyback return-on-investment rankings — from last among 276 companies as 2013 began (–56.7 percent) to No. 58 a year ago (43.85 percent) to No. 9 in the current ranking (53.5 percent).
Apple exceeded buyback ROI in the pace-setting technology, hardware and equipment peer group by more than 16 percentage points. The company beat median buyback ROI for the Standard & Poor’s 500 by more than three to one. Buying back shares at advantageous price intervals gave Apple a huge boost in buyback effectiveness, which measures the difference between buyback ROI and buyback strategy, a proxy for total shareholder return. Apple posted stronger buyback effectiveness than all but two companies, Orlando, Florida–based Darden Restaurants and Irvine, California’s Edwards Lifesciences. Buyback ROI at Apple nearly tripled its buyback strategy.
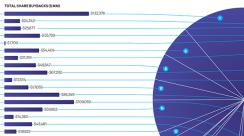
| Buyback Scorecard THE S&P 500 AS STOCK REPURCHASERSBest & Worst CompaniesIndustry Comparisons |

The roster of companies on the scorecard changes every quarter, subject to buyback activity, but each ranks 24 sectors, from automobiles to utilities. Since the scorecard was initiated, media, diversified financials and pharmaceuticals have topped sector rankings. Telecommunications, energy and utilities have lagged behind.
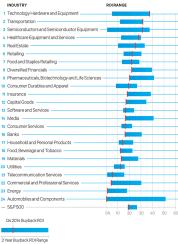
Buyback ROI data produces new metrics for shareholders who want to see whether cash earmarked for buybacks has been well spent. Led by outstanding results at Apple, says Fortuna Investors vice president of research Joseph Theriault, the technology, hardware and equipment companies recorded $132 billion in buybacks, amounting to 15 percent of share repurchases by the S&P 500 and 10.6 percent of the sector’s market capitalization.
Software and services poured $109 billion into stock buybacks, and the industry’s eight-quarter buyback ROI lands it roughly in the middle of the pack. Real estate companies and utilities together spent only $3.3 billion on buybacks, which looks smart in view of the lackluster returns of those sectors.
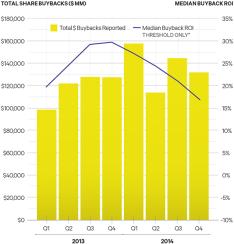
Buybacks, like everything else in financial markets, can be volatile. Fortuna used data from all eight scorecards to quantify buyback ROI volatility (see chart). Median volatility for the S&P 500 across those 12 quarters fluctuated between 20 and 30 percent, a relatively narrow range, and ended 2014 near the bottom at a relatively low level of volatility.
Significant sector differences in buyback ROI emerge. The technology, hardware and equipment group recorded 38.4 percent buyback ROI at the high end and 5 percent at the bottom. Likewise, semiconductors and semiconductor equipment turned in 37.6 percent at the top and 1.9 percent at the bottom. Both sectors ended the fourth quarter of 2014 at or near their peak buyback ROI. The software and services group and consumer services displayed less volatility overall; both ended 2014 near the low ends of their buyback ROI ranges.
In the current scorecard median buyback ROI is 17 percent, versus the 23.4 percent average market return for the S&P 500. In 2014, however, median buyback ROI slipped to lower levels generally, a trend that partially reflects declining market performance.
Buyback ROI for all S&P 500 companies also trailed total returns to shareholders by, on average, 5.5 percent, prolonging the downward tendency. The outlook casts further buybacks in an uncertain light as the bull market ages. “Managers need to contemplate how long this bull market will last for the market, their industry and especially their companies,” says Fortuna Advisors CEO Gregory Milano. The possibility of a shift in the economic climate may warrant conserving capital now to weather difficulties and resuming buybacks after a correction. Countervailing factors, notably the plunge in oil prices and continuing low interest rates (though that could change, depending on what the Federal Reserve does), argue for continuing buybacks.
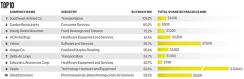
Consider Dallas-based Southwest Airlines, which tops all other companies in the latest buyback ROI ranking for the second quarter in a row. Lower oil prices gave the stock a big push, extending the return from an ongoing buyback program that has twin goals: rewarding shareholders and optimizing the capital structure. Recent buybacks have accomplished both without making bets on market timing. “We don’t time buybacks to what the stock price is,” Southwest chief financial officer Tammy Romo told Institutional Investor last June. Instead, the buyback program proceeds as cash flow allows.
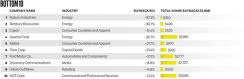
Declining oil prices had the opposite effect on Hamilton, Bermuda–based Nabors Industries, which supplies the energy industry with oil- and gas-drilling equipment and services. Dead last on the current scorecard, Nabors posted –87.3 percent in buyback ROI, versus a 6.6 percent gain in total shareholder return over the same two-year span.
Circumstances looked “opportunistic” when Nabors decided to buy back shares, says Dennis Smith, the director of corporate development and investor relations. The move followed a standstill agreement with an investor who had signaled takeover intentions. The investor arranged to exit his Nabors stake in a bought deal with UBS, leaving the company with the desire to reduce shares outstanding. “We bought 40 percent of the stock back at $24 a share,” says Smith. “We had an appetite to buy back stock and plenty of cash.” What’s more, the block sale avoided a haircut on the transaction.
No one foresaw, however, that oil prices would slide to $50 a barrel from $100. Nabors’s shares changed hands at around $12 a share in early March. “In hindsight,” acknowledges Smith, “we could have waited.”
Share repurchases at the wrong time impaired buyback ROI in automobiles and components, which lags all other sectors. Dearborn, Michigan–based Ford Motor Co. paid nearly $2 billion to repurchase shares in the second and third quarters. At year-end Ford reported a 0.5 percent drop in vehicles sold, and its shares ended 2014 at $15.50, down 10 percent from June 30. The buybacks amounted to $420 for every car the automaker sold in 2013 and 2014.
Ford (–21.1 percent) paid the sector’s heftiest price in buyback ROI; it lags all but six companies in the fourth-quarter scorecard. “It seems Ford got the timing of its buyback wrong,” says Zacks analyst Swarup Gupta. “[Earnings per share] may have been aided [by the buyback], but not enough to justify this move.”
(Click to Enlarge)
On the upside, Darden Restaurants posted the most positive change in 2014’s fourth quarter versus the fourth quarter of 2013 and secures second place overall in the scorecard. In early March, Darden, which operates Olive Garden Italian Kitchen, LongHorn Steakhouse and a number of other niche restaurant chains, notched a 12-month high — but that wasn’t high enough to disrupt the buyback program that CFO C. Bradford Richmond had alerted securities analysts about in June, at the conclusion of Darden’s 2014 fiscal year.
Under heavy pressure from activist investor Starboard Value, Darden scrambled to boost its stock price. Toward that end, it allocated $500 million to an accelerated share repurchase program in fiscal 2015 and up to $200 million in additional open-market repurchases, with funds coming principally from the $2.1 billion sale of its Red Lobster subsidiary in July 2014, Richmond said. (Starboard had pushed for the sale.) Darden took delivery of more than 8.6 million shares, Richmond told analysts on the midyear call. He expected the $500 million buyback to add 11 cents to the fiscal 2015 bottom line and 17 cents on a fully annualized basis.
Unsatisfied by results, Starboard Value exercised its muscle in October 2014 and succeeded in replacing all of Darden’s directors, installing in their place a slate headed by the hedge fund firm’s chairman, Jeff Smith.
Keurig Green Mountain, regularly ranked in the top ten, comes in at No. 3, a notch down from its spot in the third quarter. Hospital operator HCA, a newcomer, takes fourth place on the strength of $2.25 billion in well-timed buybacks. Its buyback ROI topped 61 percent, four percentage points higher than its buyback strategy. Buyback ROI exceeding buyback strategy usually signifies that the company has bought shares back at favorable prices.
The buyback story at HCA began in 2006, when Bank of America, Bain Capital, Kohlberg Kravis Roberts and the Frist family paid $33 billion to take private the U.S.’s largest hospital operator in a record-setting leveraged buyout. Four years later HCA went public again.
As HCA’s remaining private equity stake fell to 5 percent from 27 percent of shares outstanding, the buyback program helped ease some selling pressures on the stock. “Their strategy is very good because they did have a private equity overhang,” says analyst Ann Hynes at Mizuho Securities Co. She gives high marks to management for buybacks that navigated stiff agreements with lenders. “The important thing when it comes to HCA buybacks is that they were able to do this with a lot of restrictive covenants,” says Hynes.
Another quarter of solid buyback performance kept Kroger Co. at No. 6. Analyst Karen Short at Deutsche Bank credits a rigorous focus on return of invested capital, initiated in 2011 by CFO Michael Schlotman. “Up to that point buybacks were generating ROI but not a home run,” says Short. A commitment to return capital lent vitality to buybacks in conjunction with a rising stock price.
“Nobody wants earnings growth that is share-repurchase-driven,” says Short. “Just buying back shares when core businesses are fundamentally imploding is never going to help.” To see that outcome, she says, look at Safeway, not currently ranked but last seen at No. 132 in the third-quarter 2014 scorecard. Strong buyback ROI should match or exceed underlying total shareholder return; at Safeway buyback ROI lagged by a wide margin.
Foster City, California–based Gilead Sciences, at No. 10, has delivered steady top-tier buyback ROI. In February it capped this performance by announcing a $15 billion common stock buyback, set to expire five years after completion of a $5 billion buyback.
The largest buyback announcement since the start of the fourth quarter came from Atlanta’s Home Depot, now ranked at 75. From 2002 through February 3, 2013, Home Depot retired approximately 1 billion shares for $37.5 billion. The company says it will spend an additional $17 billion to buy back shares by the end of fiscal 2015. To date, it has posted strong results. A 27.8 percent buyback ROI in the latest ranking beats its peer group median by more than five percentage points and is ten percentage points over the median buyback ROI of all companies in the fourth-quarter scorecard.
Home Depot’s approach to buybacks makes it “a model citizen,” says analyst Joseph Feldman at New York–based Telsey Advisory Group. The home supply chain follows a strategy that “a mature retailer could and should do with its cash especially when it is operating well,” he says.
Changes in cash flow do not need to interrupt buybacks. “They’re not afraid to borrow and use proceeds to repurchase stock,” Feldman says. “The dividend plus buybacks helps juice total return.”
How much juice? The retailer posted EPS growth of 22.1 percent in its most recent fiscal year and net income growth of 14.6 percent. The 7.5 percent difference, says Feldman, “was the direct result of 7 billion dollars of share repurchases.”