Several years ago I was banging my head against the wall in Langley, Virginia, trying to get a clear probability estimate of a potential North Korean military event from a roomful of reluctant analysts at the Central Intelligence Agency, then my employer. A grizzled CIA veteran took me aside during a break. “The reward for getting a clear forecast right, times the probability of actually getting it right, is far less than the penalty for getting it wrong, times the probability of getting it wrong,” he advised. “Back off.”
These days I discuss economic and geopolitical forecasts with global macro traders in London and New York. These traders need clear probabilities and confidence intervals to build profitable trades. They know the rewards for getting it right can be massive — if they get it right more often than wrong. The job isn’t getting any easier, though.
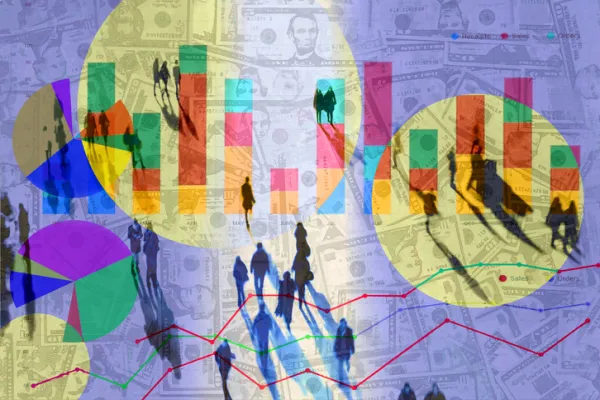
For two years now I’ve been conducting a survey of global macro traders at six-month intervals on what they consider to be the key global macro variables: a combination of asset prices, currency and interest rates, and security events. Then I examine the actual results and puzzle over what they got right and what they got wrong, and — most important — why. What habits of mind and models account for accuracy or being off the mark?
December’s survey showed that our traders believe that U.S. interest rate normalization will occur slower and later than previously expected, and that the Standard & Poor’s 500 index will go even higher but at a slower pace — against a background of greater volatility as measured by the CBOE’s VIX. They have lost faith in Shinzo Abe’s third arrow in Japan yet remain confident that Xi Jinping’s technocrats in Beijing can keep the Chinese economy growing at a respectable, albeit slower, pace. They are betting that one or more of the weakest emerging-markets players will have a currency crisis in the next six months, with Venezuela at the top of the list of suspects. Oil, they believe, will hit a floor and then bounce around $50 a barrel (for Brent crude) despite the continued expansion of ISIS in the Middle East. They predicted that Mario Draghi would make quantitative easing by the European Central Bank a reality, which he did in January, and they forecast that no “warm water” euro zone country would exit, not even a Syriza-controlled Greece, a belief that the hard-left party put to the test after taking power in late January. Surprised by the intensity of violence in Ukraine and by Vladimir Putin’s neo–cold war belligerence, the traders fear Russia will cast a dark shadow over Europe for some time to come. But aside from the Russian government and ISIS, these traders see the odds of conventional security clashes as being fairly low in the rest of the world, except for cyber- and terrorist strikes, an unpleasant but not existentially threatening feature of the New Ugly Normal.
As they were completing the survey, my trader friends already knew, more or less, how much they made or lost for their funds last year and what their split of the net take would be. The industry, in aggregate, had a mostly positive but far from stellar year, underscoring the difficulty of generating good returns in today’s markets and the angst many traders feel about their forecasts. The HFRI Fund Weighted Composite index of hedge funds finished 2014 with a gain of 3.3 percent, meager pickings compared with the S&P 500’s return of 13.69 percent. Funds covered by HFRI’s global macro index, which is where most of our survey respondents work, gained 6.2 percent. The Energy/Basic Materials fund index got hammered, losing 5.4 percent over the prior 12 months, whereas the Technology/Healthcare index knocked it out of the park (or the pitch, if you’re in London) with a gain of 9.8 percent. Investors poured a net $76 billion into hedge funds for the year, bringing total hedge fund capital to $2.85 trillion.
Also from this series:

- Global Macro: Big Risks and Opportunities in Emerging Markets
- Global Macro: Expectations Decline for U.S. Rates, China Growth
- Global Macro: Handicapping the Hazards of Geopolitical Risk
When I summarized the results of our June 2014 survey, I discussed the puzzle of soaring asset prices and suppressed volatility, as manifested by the $8.8 million California Spider that my local Ferrari dealer had on display in the shadow of the still-rising 432 Park Avenue, where the yet-to-be-constructed penthouse had just sold for $95 million. Down on earth, the VIX was flatlining at just 12.
On October 10, 432 Park was topped off. A few days after that, the VIX soared to 32 in the S&P “October surprise” correction, and bond yields plunged in the Treasury flash crash. The traders’ collective suspicion in June that volatility was “curiously, distressingly low” turned out to be prescient. October was also a fun month to be short oil. Japan’s quarterly growth figures were in the tank, and everyone was nervous that a Chinese growth collapse would dampen growth prospects in Europe and slam emerging markets even more.
There is a well-known high correlation between hedge fund bonuses and high-end sports cars. I stopped by the same Ferrari dealer in mid-January. In place of the Spider, the showroom floor exhibited a gleaming red 458 Speciale Aperta. (Well, not red but rosso corsa, or racing red.)
“How much is it, and how long is delivery?” I asked the smiling salesman.
“This has some nonstandard 458 features, so $342,000,” he replied evenly. “If we could get you an allocation, that is. Then it would be about 12 months.”
The Brent Plunge
Back in June the macro traders put a 53 percent probability on Brent oil’s staying within a band of $100 and $120, with a one-third chance that it would trade above $120 by December 2014. The chance that Brent would fall below $100 was put at just 16 percent, down from 34 percent in December 2013, reflecting a pessimistic assessment of Middle Eastern supply shocks, notably in Iraq and Libya.
The average bet was right — until it went very wrong. Brent took a vertiginous plunge below $100 in October. The price chart, for those who launder money and then scuba dive, looks remarkably like the Three Fathom Wall off Little Cayman Island — a long, shallow reef swim and then a deep blue drop into an apparently bottomless Caribbean Sea.
In retrospect, I asked a couple of traders what went wrong (if you were long) or right (if you were short).
“Two big dogs didn’t bark on the supply side,” says a Connecticut-based energy trader. “I was sure that with all this chaos in the Middle East, that some significant capacity in Iraq would go off-line, sooner or later fighting would finally shut down or blow up part of the Es Sider and Ras Lanuf terminals in Libya. The other nonevent was OPEC in November.”
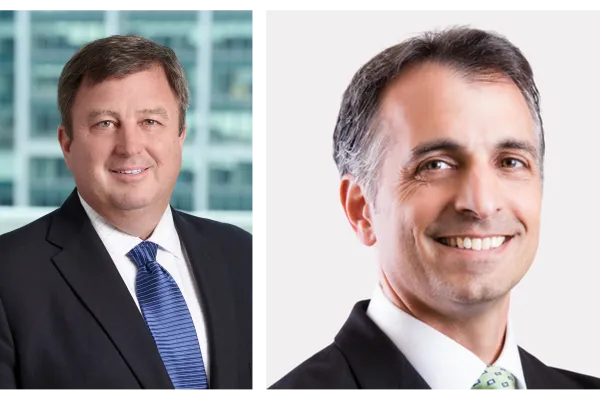
Michael Hintze, CEO and senior investment officer of London-based hedge fund CQS, agrees about the pivotal role played by the Organization of the Petroleum Exporting Countries. “This inaction on the part of the Saudis, we believe, signaled that its role as the enforcer of cartel disciplines was over,” he says. “Domestic fiscal exigencies in all the OPEC countries, including Saudi Arabia, mean that as long as the marginal cost of production remains below the current market price, there can be no discipline wrought on oil output, OPEC or not.”
In light of last year’s October surprise, what do traders expect in the first half of 2015? The consensus 51 percent bet is that Brent will maintain a trading range of $50 to $70 between January and June, with a 24 percent probability that it would trade below $50 in that period. That forecast, made in December, was looking out of date within weeks as Brent dipped below $48 briefly, but it did rebound to above the $50 mark at the end of January.
The mean view is that there is a floor somewhere between $40 and $50 and a likely upside by June. According to an oft-quoted study by consultancy Wood Mackenzie, a significant portion of global oil production becomes cash negative below $50 a barrel, and the effect becomes particularly notable around $40. At that price, the equivalent of 1.5 million barrels per day of global capacity becomes cash flow negative, including much offshore output and some “tight oil” capacity, which is produced by hydraulic fracturing, or fracking.
“To balance the market at the moment, OPEC needs to cut production by 1.1 million bpd,” says Haythem Rashed, an energy analyst at Morgan Stanley in London who bases his estimation on output forecasts by the International Energy Agency and the U.S. Energy Information Administration. “Therefore, if 1.5 million bpd of production were actually shut in at $40, this would entirely absorb the current oversupply in the market.”
This prediction of a $50 to $70 trading range supported by the cash-flow-negative capacity figure may be mere wishful thinking. “We cannot forecast oil prices more than six months ahead, let alone over five-year, ten-year or 30-year horizons,” says Reuters energy analyst John Kemp. “We can identify some of the big forces shaping the market; we can try to identify emerging technologies and trends. We can think in terms of scenarios and probabilities. We can try as far as possible to balance our options. We can think about a mixed strategy that pays off in a variety of supply/demand/price environments. But we do not have a crystal ball.”
James Shinn is lecturer at Princeton University’s School of Engineering and Applied Science (jshinn@princeton.edu) and chairman of Teneo Intelligence. After careers on Wall Street and Silicon Valley, he served as national intelligence officer for East Asia at the Central Intelligence Agency and as assistant secretary of defense for Asia at the Pentagon. He serves on the boards of CQS, a London-based hedge fund, and Predata, a New York–based predictive analytics firm, and serves on the advisory board of Kensho, a Cambridge, Massachusetts–based financial analytics firm.