By Shane Hurst, Brad Fraser, Daniel Chu, CFA, Moaz Mohib, CFA, and Chris Hillsdon
Key Takeaways
- While infrastructure assets can generate the same returns and growth regardless of their ownership structure, listed and unlisted entities differ in terms of sustainability, capital structure, performance, liquidity and exposure to structural trends.
- Listed infrastructure offers access to a greater investment universe overall, with more exposure to traditional infrastructure sectors.
- In addition to helping listed infrastructure companies better meet capital intensity, funding flexibility and liquidity demands, greater scale among listed players also helps them manage supply chain challenges.
Infrastructure’s Unique Characteristics: A Brief History
Over the past two decades, investing in both listed and private market infrastructure strategies has become mainstream. Allocations have grown as investors seek greater exposure to essential assets with stable and growing cash flows, inflation protection and lower correlations with equities compared to other asset classes.Prior to World War II, infrastructure by and large was owned by government, which had little incentive to improve efficiency or service these assets. After the war, with governments needing to finance deficits, funding the growth of infrastructure assets became the mainstay of the private sector via both public (referred to as listed) and private (unlisted) markets. However, this did not occur evenly.
Initially, public perception and the desire of communities to own a part of these essential infrastructure assets meant that most privatization went the way of listed markets. This led to a deep pool of liquid, traditional core infrastructure, such as utilities, transport and communication assets. In the U.K., share ownership was seen as an important way to encourage an “entrepreneurial society” — as former Conservative Chancellor of the Exchequer Norman Lamont put it — in which individuals became actively engaged in the economy by owning key assets (such as their house, or shares in utility providers). Share ownership was also seen as a way of “spreading wealth” by giving people a stake in potentially profitable organizations.
Most of the public flotation of utilities in the mid- 1980s were at least partly motivated by this desire to spread share ownership. In particular, the privatization of British Gas, accompanied by the widely publicized “Tell Sid” advertising campaign, resulted in an estimated two million individuals buying shares for the first time.1
There was also a view by regulators (as expressed by the national association representing the State Public Service Commissioners in the U.S.) that infrastructure held by private equity was suboptimal when compared to listed vehicles, due to the greater availability of information for listed equities as required by the Securities and Exchange Commission.
Over the past 10 years, the growth of “alternatives” allocations has fueled the popularity of exposure to unlisted infrastructure. Estimates of dry powder at the end of September 2021 sat at US$300 billion, according to the Global Listed Infrastructure Organization, and fierce competition for private market deals has put downward pressure on available returns for traditional infrastructure assets while also pushing private investors to different areas of infrastructure.

In ClearBridge’s 2020 paper, The Listed Infrastructure Opportunity, we show that listed and unlisted infrastructure allocations are complementary, and it is possible to enhance infrastructure outcomes by using both. The ultimate decision on the split between the two should be optimized for investor preferences such as liquidity, choice of underlying asset risk exposure, sensitivity to short-term price volatility and the opportunistic use of market mispricing and arbitrage.
Here we outline some further key considerations for investors as they think about when to access listed infrastructure markets.
Listed Affords Greater Access to Desired Assets
While what matters most for infrastructure investors is access to attractively priced, high-quality assets that have the potential to deliver the cash flows, dividends and total returns to match their investment objective, it is clear the opportunity size is not the same for listed and unlisted assets, nor is the skew of global assets (Exhibits 1 and 2).Exhibit 1: Infrastructure Assets in Closed-End Funds (Unlisted)
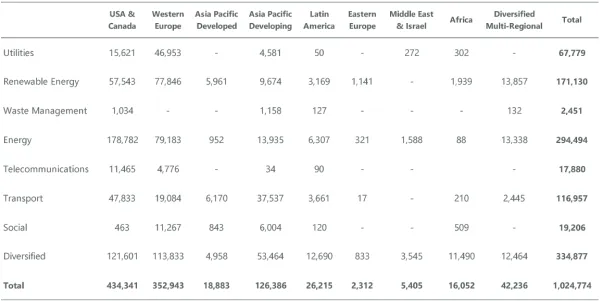
As of Nov. 30, 2021. Source: ClearBridge Investments, Preqin. In USD millions.
Exhibit 2: Listed Infrastructure Assets
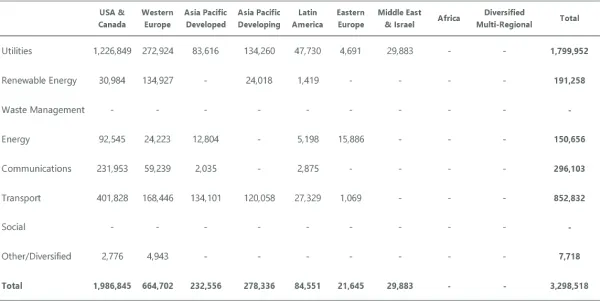
As of Nov. 30, 2021. Source: ClearBridge Investments. Internal calculation of listed infrastructure universe. By market capitalization, in USD millions.
Exhibits 1 and 2 show several key differences between the listed and unlisted infrastructure universes:
- Size: The listed universe, as defined by ClearBridge, is over 3x the size of the unlisted universe.
- Region: There are 2x more infrastructure assets in listed structures than unlisted structures in Europe, 4.5x more in North America and 12x more in Asia Pacific.
- Asset class: With the exception of renewable energy, non-traditional assets such as waste management, and social infrastructure, listed structures provide greater universe sizes than unlisted infrastructure assets.
Listed vehicles have often been the consolidator and operate these assets to generate higher returns than unlisted counterparts due to economies of scale. This is nowhere more apparent than in communication tower infrastructure, where companies like American Tower and Cellnex are global consolidators.
Case Study: Data Usage Demanding More Communication Towers
Investing in communication towers is one of the best ways to gain exposure to growing mobile device penetration and data usage. These companies’ business model is robust, revenue is contracted and usually includes an initial non-cancellable term of 5–10 years, with the majority of contracts renewed after this period. Contracts also have provisions for inflation protection with escalators of CPI or better. As a result, these assets are highly cash-flow generative with minimal churn.Recent studies foresee data usage in North America growing at 27% per year over the next five years, driven by the rollout of 5G, users of which have consumed up to 2.7x more mobile data than those using 4G. This growth in data usage has caused mobile network operators to invest significantly in their networks to avoid congestion and improve service quality as data usage grows, benefiting tower companies.
In North America there are three large publicly listed tower companies, making up an estimated 88% of the tower market, with the remaining 12% owned by private companies and a small number kept in-house by network operators.
Over the past few years, there has been growing interest from private capital in tower assets. Of the 11 notable acquisition transactions of tower portfolios in 2020–2021, nine were acquired by private operators. This compares to just four transactions in the prior two-year period (2018–2019) with only two portfolios acquired by private operators (Exhibit 3).3 Evidence suggests that investing via publicly listed companies remains the best option in terms of size, return potential and site location.
Exhibit 3: Growing Interest in Tower Assets from Private Capital
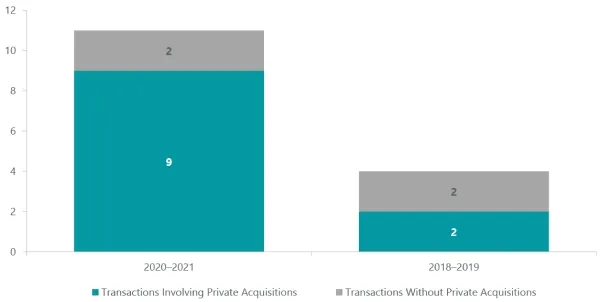
As of Dec. 2021. Source: ClearBridge Investments.
Greater Size Means Greater Opportunity
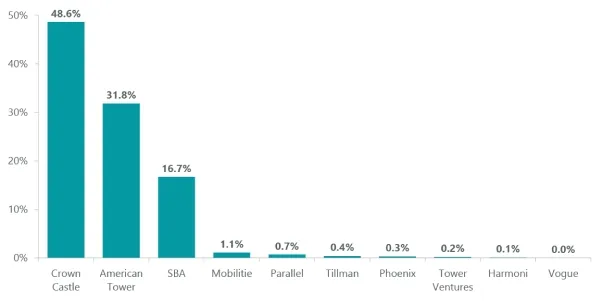
Over the past two decades, listed tower companies have achieved a portion of their growth by acquiring other tower portfolios either via sale or leaseback deals with the network operators or through the purchase of other independent operators. As a result, these companies now have a comparatively large and geographically diverse portfolio of sites. American Tower, the largest tower operator in the U.S., has over 40,000 sites. This contrasts with the privately owned tower companies, which have at most a few thousand sites (Exhibit 4).A hurdle for private operators with a smaller portfolio is that they are likely located in one geographic area and so will miss opportunities focused in other regions. For example, a tower company based in Florida will not benefit if an operator needs to enhance its network coverage in New York.
Further, the scale of the listed operators means they have a greater share of metropolitan sites, which will receive most of the initial 5G build, as carriers look to deploy new spectrum to customers in the most efficient way possible. More than 97% of Master Service Agreements (MSAs) in the U.S. are contracted with three listed tower companies (Exhibit 5).
Exhibit 4: Listed Owner American Tower Versus the Largest Unlisted Operators of Private Towers
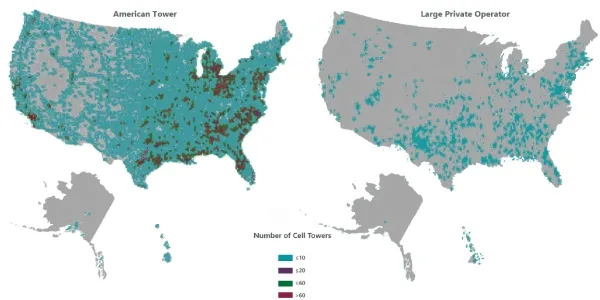
As of Jun. 7, 2021. Source: UBS.
Exhibit 5: Top 20 Share of MSAs
As of Jun. 7, 2021. Source: UBS.
Higher Tenancy Ratios Support Higher Returns
Another advantage of listed companies is the returns they receive from their sites are far superior to that of private portfolios. This is due to listed companies having more established portfolios, often in developed areas with greater data traffic and higher tenancy ratios. Returns achieved from a given site greatly improve with the addition of a second tenant (Exhibit 6). In contrast, a new or built-to-suite site is less likely to need to have an additional tenant and achieve the same level of returns.This disparity in returns is further exacerbated by the listed company’s superior cost of capital. For example, American Tower has an all-in cost of debt of just 2.4%, where private market cost of debt is on average 4.0%.4 This means that a site’s returns are more likely to be above the required return rate, even with just one tenant.
Exhibit 6: The Power of More Tenants on Tower Infrastructure Assets
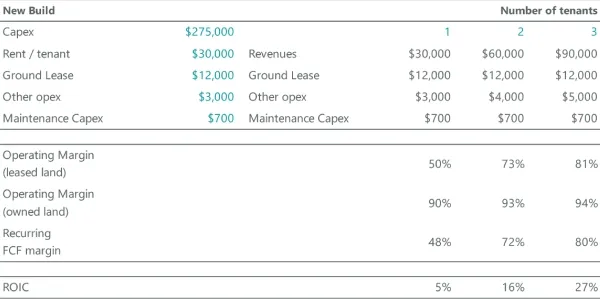
Source: ClearBridge Investments.
Existing Tower Sites Have Advantages
One avenue for a private investor to gain access to tower assets would be to build a portfolio of new sites. However, while around 500 new towers are built each year, zoning and environmental permitting represent a significant limitation on new site construction and, in some cases, it may take several years for approval. As a result, it would be prudent for the investor to have at least one customer committed to using the site prior to building.The length of the permitting process also improves the attractiveness of the listed incumbents, as it is more advantageous for a network operator to immediately deploy an existing site rather than waiting for a new site to be built. Further, the location of the new site is likely to be in a marginal, less established area; i.e., all the good sites already have towers.
Case Study: Capital Intensity Key for Renewable Energy
Capital Intensity Calls for Scale, Benefiting Listed Structures
The push for net-zero and decarbonization is accelerating the shutdown of carbon-emitting power generation assets (coal and gas) in favor of wind and solar assets, which have reached cost parity. While these projects are capital intensive, corporations incentivize buildouts by offering long duration (10–15 years) fixed price per MWh contracts.The listed investment space provides exposure to the largest renewable energy companies in the world. We believe size is important in a capital-intensive sector as it comes with scale advantage in operational execution, sourcing growth and accessing equity markets for capital. Funding flexibility also remains key to managing balance sheets, and listed renewables therefore have further optionality. Finally, the liquidity provided in the listed space allows asset allocators to be more flexible in rotating their funds based on how the structural outlook of renewable energy assets evolves over the decades ahead.
Size Helps Overcome Supply Chain Crisis
In addition to helping listed infrastructure companies better meet capital intensity, funding flexibility and liquidity demands, scale among listed players also helps them manage supply chain challenges. For example, despite being exposed to the global supply chain crisis in 2021, NextEra Energy (US$141 billion in market cap as of June 21, 2022), Brookfield Renewable (US$12.5 billion) and AES Corporation (US$13 billion) made no changes to forward guidance as OEM companies prioritized delivery to their largest customers.Management teams of NextEra Energy and Brookfield Renewable also affirmed higher returns (double digits on a levered basis) relative to smaller players, with their size allowing for economies of scale in managing operations and maintenance, receiving bulk discounts across equipment, and using their larger footprint to diversify wind/solar weather risks and manage exposure concentrations to different regulatory jurisdictions. Beyond their existing assets, NextEra and Brookfield have a development pipeline that spans over 20GW.
Listed Renewables Exposure Offers Access to Funding and More Flexibility
Size is also key in access to funding. Unlisted investments will continue to depend on private funding to build a renewables platform that benefits from scale (key to growth and execution as noted above), though this becomes challenging once funds are closed after raising is complete.In 2020 Brookfield Renewable was able to issue stock to raise funds to acquire Terraform Power, a deal that was accretive by >10% to funds from operations (FFO) per unit. We view this as a key example of how listed equities can tap markets for easy funding to quickly gain size and scale. Brookfield now operates the largest portfolio of distributed generation assets in the U.S. (>2,000 MW). We believe it is no coincidence the largest renewables companies are listed, the advantages of easier funding in a capital-intensive sector allowing for a more effective “go-to-market” strategy.
While renewable energy continues to be a structural growth thematic, there is an increasing argument that as funding toward decarbonization continues, returns will be pressured. If this starts to play out, an asset allocator with listed access can opportunistically reduce exposure to this thematic. Execution and other idiosyncratic risks can also be diversified away by owning multiple listed players, which provides exposure to different management teams, international markets and asset types.
Case Study: Listed U.K. Water Earn Incentive Returns
The U.K. water sector offers an example of a regulatory regime with structural benefits for listed infrastructure. It is common for regulators of essential service companies around the world to set return benchmarks that companies subsequently outperform. This is generally due to the operational and/or financing efficiencies listed companies can achieve; these promote long-term benefits for companies and ratepayers.Following a period from 2001 to 2018 in which the U.K. water industry regulator Ofwat’s policies resulted in a relatively narrow range of return outcomes across the industry, a deliberate change occurred in the 2016–20 regulatory period as Ofwat attempted to reward better-run companies. Regulators sought to agree on a series of operational and customer engagement benchmarks with companies and attached financial penalties or incentives to the outcomes. Customer engagement benchmarks reflect social factors that are some of the key determinants for utilities as regulators seek to align customer and company needs. As a result, listed companies developed a range of tools to remunerate management such as allowing some companies to strive for improved execution and achieve better returns.
Following the 2016–20 regulatory period, company-reported ROE has exceeded the regulator-allowed ROE significantly, indicating that these companies are outperforming the regulator’s operating assumptions and agreed business cases and arguing for the increased ability for listed U.K. water companies to outperform due to operational skill. In other words, where listed water companies have explicitly been able to earn incentive returns, they have earned them.
Case Study: Listed Airports Lead on ESG
Airports provide both aeronautical services, such as landing/take-off, terminal infrastructure, refueling and road access, as well as commercial services such as retail, car parking and real estate for airport users. Airports have a range of ownership models, from fully privatized to partially privatized to government owned (Exhibit 7). The ownership model often dictates whether assets are listed or unlisted. In reality, due to the shareholders, regulation and strategic importance of these assets, there is little difference between listed and unlisted vehicles except for ESG characteristics and liquidity, where listed airports have an advantage.Exhibit 7: Airport Ownership Models
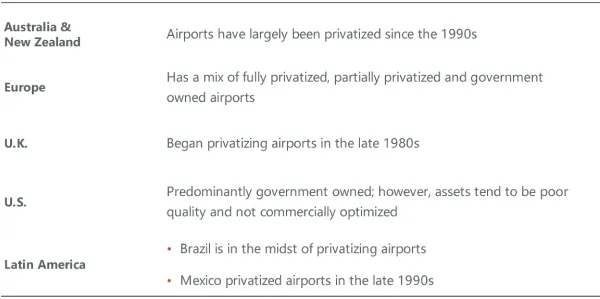
Source: ClearBridge Investments.
Given the wide variety of ownership models, few markets have a combination of both listed and unlisted, privately owned assets. European listed airports are partially privatized, with government typically owning majority stakes. Australia and New Zealand, having privatized airports many years ago, had, until recently, both unlisted and listed airports (such as Auckland Airport and Sydney Airport, the latter recently privatized and delisted).
While listing status does not greatly impact the regulatory environment, access to capital, leverage or operating conditions for airports, one key area where we believe being publicly listed is important is ESG. Specifically, the disclosure requirements and ability for a changing shareholder base to influence management and board focus for listed airports normally results in a strong focus on ESG.
Australian and New Zealand Airports Are Global ESG Leaders
For Australian and New Zealand airports, there is some evidence of this, with Sydney Airport being rated very highly on ESG characteristics (prior to its recent delisting) and listed airports consistently rating higher than unlisted airports by third-party ESG ratings providers (Exhibit 8). These airports, in addition, are leaders in ESG at a global level (Exhibit 9). We acknowledge the sample size is very small, and that Australian pension funds, the typical owners of unlisted airports, have a strong focus on ESG. However, with pensions funds tending to report on ESG at a fund level, rather than at an individual asset level, as listed companies do, listed airports generally offer more detail and transparency than unlisted airports.Exhibit 8: MSCI ESG Ratings of Australian and New Zealand Airports (Prior to Sydney Delisting)
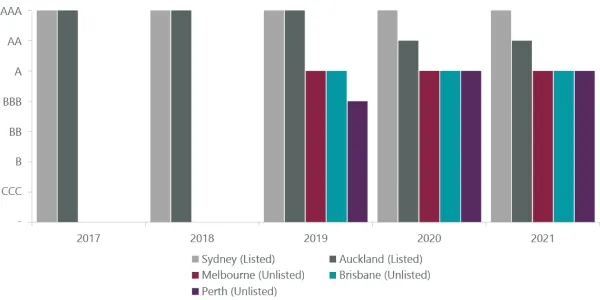
As of Oct. 22, 2021. Source: MSCI, ClearBridge Investments. Ratings reflect most recent rating as of end of each year.
Exhibit 9: Distribution of ESG Ratings for MSCI ACWI, Transport Infrastructure (n=26)
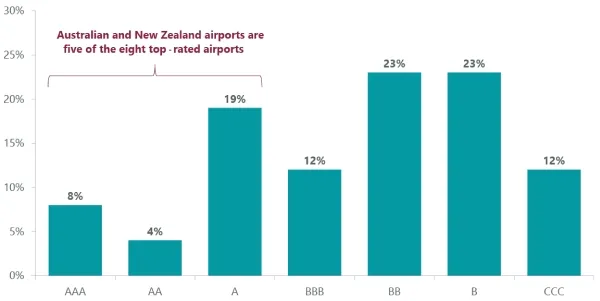
As of Oct. 22, 2021. Source: MSCI, ClearBridge Investments. Of 26 samples, Sydney (AAA), Auckland (AA), Melbourne, Brisbane and Perth (A) represent five of the eight top-rated airports. Reflective of Sydney Airport prior to privatization in 2022.
Summary
Our research shows listed and unlisted infrastructure allocations are complementary and it is possible to enhance infrastructure outcomes by using both. Investors will want to weigh liquidity, underlying asset risk, volatility and the opportunity for arbitrage when deciding between listed and unlisted markets. Given the above considerations of the value of scale for listed players in communication towers and renewable energy sectors, the role of regulatory structure in listed U.K. water and ESG and management outperformance by listed airports, investors will also want to take account of sector-specific characteristics as well.1 Louise Butcher, David Hough and Christopher Rhodes, “Privatisation,” Research Paper 14/61, November 20, 2014. House of Commons Library. https://researchbriefings.files.parliament.uk/documents/RP14-61/RP14-61.pdf.
2 We consider regulation where returns are attractive, recovery of costs and capex is timely, and regulators work in partnership with asset owners to further develop their asset bases to be favorable.
3 Notable defined as a portfolio of towers; the smallest disclosed transaction price in this set was US$80 million.
4 As of Dec. 7, 2021. Source: RBC.