Emerging-markets assets have staged a mild recovery thus far in September after a fairly intense summer sell-off. Most obviously, emerging-markets equities have rallied nearly 9 percent from their lows on August 28, while other markets have posted gains as well: External debt spreads have narrowed, local bond yields have eased, and currencies have appreciated.
These moves have likely come in response to three developments. First, U.S. Treasury yields have broadly stabilized, at least since the August labor market report on September 6. Second, emerging-markets policymakers have taken modest steps to calm markets and to support currencies, exemplified by the new governor of the Reserve Bank of India, who announced a series of financial liberalization measures in his first public pronouncement. Third, and probably most important, emerging-markets growth data flow has improved. Purchasing manager indexes rose significantly in August, demonstrating that emerging-markets economic activity is benefiting already from stronger developed-markets growth. And the August data for China built on the modest acceleration apparent in the July figures, suggesting that the worst is over for now in the emerging markets’ most important economy.
Where has the down-and-up move of the past few months left emerging-markets assets in valuation terms? The sell-off appears to have created a degree of cheapness. Abstracting from fundamental considerations, the greatest value seems to exist in external debt and in equities. In neither case, however, does this cheapness look extreme by historical standards.
In external debt, we can compare sovereign spreads with U.S. credit indexes of roughly comparable credit quality. The investment-grade portion of J.P. Morgan’s Emerging Market Bond Index (EMBI) Global Diversified Index tends to trade in close alignment with BBB-rated U.S. corporate bonds, as Chart 1 shows. The investment-grade part of the EMBI had moved into expensive territory by the end of 2012 but now looks relatively cheap. Compared with what is usually a slightly negative gap, the spread difference at 14 basis points between EMBI investment grade and U.S. BBB stands about 0.7 standard deviations wider than its average between 2004 and the present.
Chart 1: EMBI IG Component and U.S. BBB Spread Over Treasuries (bp)
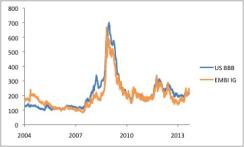

Source: Bloomberg; data through September 12, 2013
High-yield emerging-markets sovereign debt has made an even larger move. After consistently trading tight to B-rated U.S. corporate bonds since late 2005, the high-yield portion of the EMBI now offers roughly 100 basis points more in spread than its U.S. counterpart, as you can see in Chart 2. This apparent cheapness, though, warrants caution. The U.S. default rate is very low by long-term standards, supporting domestic high-yield valuations. And several significant emerging-markets countries, including Venezuela, Argentina and Ukraine, are dealing with difficult domestic challenges. In this case, the valuation swing may simply reflect fundamentals.
Chart 2: EMBI HY Component and U.S. B Spread Over Treasuries (bp)
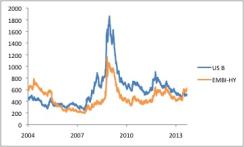
Source: Bloomberg; data through September 12, 2013
While high-grade emerging-markets external debt appears cheap, local debt does not yet offer compelling values, at least at the level of the overall index. A metric that has proved useful in the past is a comparison between the yield on the Government Bond Index–Emerging Markets (GBI-EM) Global Diversified local-market index and the ten-year U.S. Treasury, adding the emerging-markets credit default swap spread to the latter (to capture credit risk borne by emerging-markets investors that does not exist for Treasuries). The resulting excess spread measures the compensation received by local-market emerging-markets investors for taking currency, local idiosyncratic duration and liquidity risk. Since 2005, but excluding a one-year stretch during the financial crisis, this spread has averaged 113 basis points. As Chart 3 shows, moves below 100 basis points typically signal periods of excessive valuation that result in negative returns over a three-month period.
Chart 3: Local EM Debt Yield vs. 10-Year U.S. Treasury and 5-year EM CDS (%)
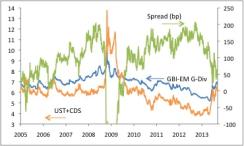
Source: JPMSI, Bloomberg, JPMAM; data through September 12, 2013
While local yields have retreated in recent months, they have been synchronized with U.S. Treasuries, with little additional move, reflecting the rising credit risk premium. At 59 basis points currently, the credit-adjusted spread does not look cheap.
On the face of it, emerging-markets corporate debt greatly outperformed sovereign credit during the sell-off. The spread on J.P. Morgan’s Corporate Emerging Market Bond Index (CEMBI) widened much less than did the EMBI, as Chart 4 shows, and the gap between the two that had prevailed since early 2008 closed. Some of that move, however, reflected composition differences, with the CEMBI being more heavily weighted toward relatively low-beta Asian and Middle Eastern issuers.
Chart 4: EMBI and CEMBI Spread Over Treasuries (bp)
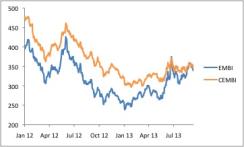
Source: Bloomberg; data through September 12, 2013
Looking at subindexes for the eight countries that represent at least 4 percent of both the CEMBI and EMBI tells a slightly different story. For many countries, the EMBI underperformed, as you can see in Chart 5, experiencing widening spreads in percentage terms than that of the country’s CEMBI component. But that pattern did not apply across the board, and a fair amount of the CEMBI’s outperformance appears to have come from a handful of countries. In Mexico, the CEMBI spread actually tightened in the sell-off, while the EMBI component widened by 40 percent. The CEMBI appears to have outperformed, but not quite to the degree that the overall index implies. Still, it now appears more expensive than external debt.
Chart 5: Change in Spreads, May 14 to Aug. 29, 8 Country Sub-Indexes, EMBI and CEMBI (%)
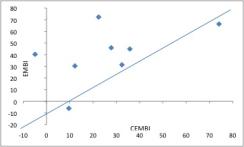
Source: Bloomberg, JPMAM; data through August 29, 2013
With respect to currencies, blanket statements about valuation pose conceptual and practical challenges, and a country-by-country approach makes better sense. We can, however, compare the summer sell-off with previous episodes of emerging-markets currency depreciation. Before this year, emerging-markets foreign exchange as a whole had suddenly and significantly weakened on seven occasions (including during the financial crisis). In those periods, forex fell by a median of 7.2 percent over 41 calendar days, which you can see on Chart 6.
Chart 6: JPMorgan EM Currency Index
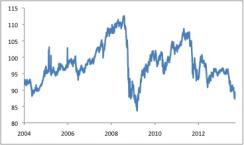
Source: Bloomberg; data through September 12, 2013
This summer emerging-markets forex dropped 9.4 percent in a 117-day timeframe, constituting a fairly large move by standards of the past decade. Again, some caution is appropriate, given that emerging-markets central banks are defending currencies less assiduously than in the past (as “fear of floating” wanes) and bearing in mind that the global monetary policy tide has begun to turn. On the other hand, the summer forex sell-off easily exceeded one that began in April 2004, another occasion in which Fed policy shifted.
What about equities? Here, just how cheap equities appear depends on the metric. Emerging-markets growth has been relatively weak since mid-2011, justifying much of the underperformance of emerging-markets equities since then. Expected earnings for the MSCI emerging-markets equity index over the next 12 months peaked in July 2011 and have fallen 14 percent since, whereas a comparable measure for the S&P 500 has risen 12 percent.
At the moment, as shown on Chart 7, emerging-markets equities are trading at 10.5 times the next 12 months’ earnings, compared with an average from 2004 to the present of 11, or 0.4 standard deviations cheap. The S&P multiple, meanwhile, stands at 14.2, versus a 13.9 average for the past ten years.
Chart 7: Price-to-earnings Ratio (NTM), S&P 500 and MSCI EM
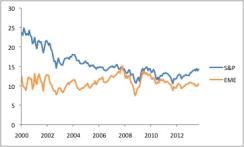
Source: FactSet, Bloomberg, JPMAM; data through September 2013
Again, emerging-markets business cycle data have recently taken a turn for the better, and earnings expectations edged upwards, a trend likely to continue if growth recovers. Equities look cheaper on a price-to-book basis, a less cyclically dependent measure. The MSCI emerging-markets index currently trades at 1.5 times price-to-book, compared with 1.9 on average from 2004 to the present, a full standard deviation cheap. By contrast the S&P 500 is at 2.5 times, marginally above its period mean. These relationships can be seen on Chart 8.
Chart 8: Price-to-Book Ratio, S&P500 and MSCI EM
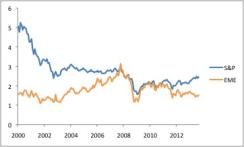
Source: FactSet, Bloomberg, JPMAM; data through September 2013
This tour around emerging-markets valuations suggests that two components in particular stand out as bargains: high-grade external sovereign debt and equities. In neither case, however, do these undervaluations look extreme by long-term standards. Most likely, these two asset classes will appeal to investors who believe that the nascent upswing in the business cycle will continue, boosting earnings expectations and perceived creditworthiness. Such a development would help make external debt and equities look even more compellingly inexpensive.
Michael Hood is a market strategist for J.P. Morgan Asset Management.
Get more from J.P. Morgan Asset Management.