Target date funds continue to gain acceptance with plan sponsors and fiduciaries looking for a single, professionally managed default vehicle for their participants. Cerulli Associates projects that target date funds will capture more than 63% of 401(k) plan assets by 2018.1 Despite this increase in popularity, the asset management industry continues to compete chiefly on the basis of relative risk and performance. While good relative performance can certainly help, over the long-term what really matters to plan participants is the level of income their savings can support throughout retirement. That level of income is entirely determined by the combination of absolute portfolio returns and savings contributions achieved over the life of the retirement portfolio. Ensuring that participants start saving early, grow their contributions, and stay on track are all as important for long term success as achieving the highest risk-adjusted returns.
The ability to achieve a desired retirement income is commonly measured as the probability of running out of money by a given age.2 This probability is referred to as a target date fund’s probability of success (POS). For plan sponsors it is a critical measure during the selection and monitoring process. It is not uncommon for target date providers to claim probabilities of success on par with perfection for their particular target date series. Such high probabilities, if taken at face value, suggest that target date funds have all but solved the lifecycle investment problem. While these claims have helped accelerate the adoption of target date funds, a broader understanding of success probabilities suggests a more nuanced picture. How exactly is the POS measured? What assumptions about participant behavior are implicit in these claims? And most importantly, how must the respective asset classes behave in order for target date funds to fulfill their potential?
The first part of this paper looks at how the POS is measured and its relationship to the choice of expected return inputs. The second part examines the sensitivity of income expectations to different return assumptions, and finally, we consider the outlook for asset class returns.
Probability of Success
In order to examine the POS, we first need to develop a simplified understanding of how target date funds are built and designed. A common approach for target date design starts with generating appropriate assumptions for average income growth and savings rates for the intended participants. These assumptions provide the basis for the cash flow building blocks that are invested in the portfolios. The cash flow projections are then coupled with estimates of asset class expected returns and risks in a simulation framework to generate the resulting glidepaths. The purpose of the simulations is to capture the average expected behavior of the assets over time and identify a glidepath that maximizes the POS. While simulation approaches differ in their level of sophistication, they all share the same core inputs: expected asset class returns and risks. While there is much debate about the appropriate income growth and savings rates, there is typically much less scrutiny of expected returns.
Although this simple sketch glosses over many of the details, it captures the basics of target date design. As a result, we can begin to tease out some of the implications of the POS measure. First, the POS only applies to participants that can benefit from the full contribution and investment horizon. A seventy year horizon is sufficiently long to forgive many asset return and saving sins. For most participants invested in target date funds today initially investing in a target date fund in their 30s, 40s, or even 50s—they don’t have this inherent advantage. Second, the POS depends in large part on the feasibility of income and savings rate assumptions that provide the basis for the expected cash flows. The desire to close the gap between observed and assumed participant behavior has prompted recent shifts in plan design to automate enrollment and savings rate escalations. Nudging participants towards earlier and better savings habits is more than half the battle in achieving retirement success. This underscores the importance of good plan design and participant education. While significant progress has been made to understand and address participant behavior, few changes have altered the choice of expected returns.
A key assumption driving the POS estimate is the inputs for expected asset class returns and risk. In many cases, asset managers simply derive their inputs from historical returns. As well as being expedient, using historical returns is condoned by mainstream finance theory. This is important for understanding success probabilities for two reasons. First, historical returns are in the eye of the beholder. Small changes in time periods or instruments can have a big impact on measured success probabilities. This is especially true for early target date series that launched in the late 90’s and estimated their glidepaths on the basis of very high equity expected returns. After a 20-year bull market, an innocent extrapolation of recent history led some glidepath designers to use unrealistically high equity returns. If these glidepaths are not revisited, the high POS may simply reflect the high embedded historical returns rather than any chance of actually meeting retirement goals under current conditions. Second, declaring that asset classes are preordained to deliver a particular level of return assumes away the unpleasant reality of time varying expected returns. This is especially relevant today when expected returns are likely to be lower than suggested by long run averages.
Implications of Lower Returns on Income
In order to examine the sensitivity of retirement income to changes in expected returns, we perform a simple simulation. We simulate the experience of a hypothetical 25 year old participant who begins investing in the target date series immediately upon entering the plan and remains invested until retirement at age 65, at which point we assume the participant begins drawing down from the portfolio until age 95.
Although target date funds are diversified across multiple asset classes, in order to keep things simple we restrict our analysis to a hypothetical target date fund made up of stocks and bonds.
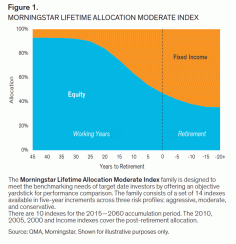
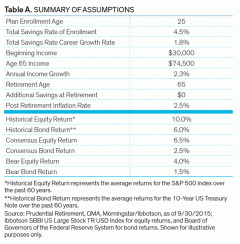
We used the Morningstar LifeTime Allocation Moderate Index glidepath to determine the allocations to stocks and bonds over the life of the participant. This glidepath series is a generally accepted market index series constructed to represent the typical glidepath (Figure 1 displays the equity glidepath of the Morningstar Lifetime Allocation Moderate series). Table A summarizes the assumptions we used for savings rate, income, total savings, and return scenarios. We keep all assumptions fixed except for asset returns.

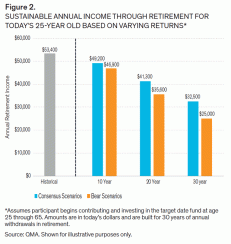
As a first step, we generate three simplistic return scenarios: A scenario based on the long-term record of generous equity and bond returns, a “consensus” scenario that captures the lower expected return views of many in the industry, and a bear case scenario that assumes an even more pessimistic view of returns going forward. We estimate the available annual income assuming a 30-year drawdown. If we simulate the retirement income using the historical return scenario, we estimate a retirement income of $53,400.3 Assuming permanently lower returns leads to a self-evident decline in annual retirement income to $15,700 and $8,300 for the consensus and bear scenarios, respectively.

Thankfully, a permanently lower return environment is too severe for even the most ardent perma bear. A more reasonable assumption is to start with low returns and then mean revert them back to historical averages over some period. This is more consistent with our understanding of asset class behavior. Nevertheless, the speed of mean reversion remains an important open question. For the purposes of our analysis we assume three different mean reversion horizons: 10, 20, or 30 years. For simplicity we assume that returns mean revert at the end of each period, rather than phasing in the change over some time span. Although the choice of horizon is partially subjective, we believe it captures the broad confines of historical low return episodes.
Figure 2 shows the effect on retirement income for the fast, medium, and slow mean reversion horizons of 10, 20, and 30 years respectively. For the shortest horizon, expected income declines by almost 8% for consensus and 12% for bear return scenarios compared to historical. It is remarkable that even a relatively short period of low returns – ten years – still has a meaningful impact on expected retirement income. This is perhaps all the more surprising given that we assumed that the low return environment occurs in the first ten years of work when typical retirement balances are small and the portfolio has several decades to recover.
If the low returns persist for an additional ten years, the participant’s annual retirement income drops further, down to $41,300 and $35,600 for consensus and bear returns, respectively. Finally, if we assume a 30-year period of low returns before reverting to historical levels, annual income during retirement is reduced further to $32,500 for consensus returns and to $25,000 under the bear scenarios.

Time to Lower Returns Expectations?
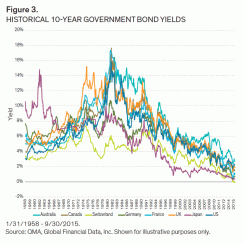
The following graph shows the evolution of long-term government bond yields for some of the major developed markets. Long-term rates have been on a steady decline for the better part of thirty years. Since 2008, this process has accelerated as central banks have converged on a grab bag of policies to reduce short- and long-term interest rates at any cost. The combination of zero interest rate policies, asset purchases, and in some cases even direct currency intervention has driven global yields to their current all-time lows. Far from being inflationary however, low rates have been accompanied by stagnant or even falling prices. Although portfolios have benefited from the increase in bond prices as yields have fallen, lower yields portend substantially lower bond returns going forward.

Regrettably, prospective equity market returns are also likely to be challenging. In a simplified view of the world, high equity prices relative to fundamentals–e.g. sales, earnings, book value– reflect high growth expectations and vice versa. As a result expected returns are constant. This conventional view however, was undermined by the tech bubble collapse and then shattered by the globalfinancial crisis less than a decade later. Institutional investors are ostensibly recognizing that high prices do not reflect high expected growth, but rather are a harbinger of low returns.
For long-term savers, such as those at the front end of a glidepath, the subdued return environment is challenging but does not have to be insurmountable. The key question and crucial ingredient is how long the current environment might last. In the case of bonds, for example, long-term investors should not fear a rapid increase in yields so much as a prolonged period of microscopic yields and correspondingly tiny returns. Standard glidepath design implicitly assumes that over a sufficiently long investment horizon, periods of low returns are balanced out by periods of high returns. Even so, we believe investors and target date providers alike need to understand the impact of lower returns on income expectations. For the former, that could mean saving more and working longer. For the latter, assumptions may need to be revised and POS adjusted to reflect changing expected returns.
Conclusion
For the average US worker, the goal of investing is to build a source of retirement income. One of the appeals of target date funds is the reassuring certainty communicated by success probabilities. Although an important metric, success probabilities should not be taken as the final word on lifecycle investing. To be compelling, a success probability must be updated regularly to reflect the evolving participant makeup and changing economic environments. Fiduciaries need to better understand how these measures are calculated and target date providers need to communicate the sensitivity of their estimates to different assumptions. These simple steps would go a long way to transforming the success probability from a descriptive characteristic to a useful planning tool.
Author: Jeremy Stempien, Product Specialist
1 Hersch, Warren S. “Target-date assets to hit $1.7T by 2018,” LifeHealthPro.com (2015),
http://www.lifehealthpro.com/2014/03/26/target-date-assets-to-hit-17-trillion-by-2018; 26 March 2014.
2 Probability of success can also be measured as the probability of achieving sufficient assets to purchase an equivalent annuity on the last day of work.
3 Annual available retirement income is assumed to grow at 2.5% inflation rate.


