Eric Leininger, CME Group
AT A GLANCE
- The 10-year treasury yield moves in the week following recent Consumer Price Index releases show dramatic market reactions
- Movements in interest rate volatility in the day and week following CPI releases have been consistent over the past year, according to CVOL readings
The Arc of CPI
Since the beginning of 2022, year-on-year CPI moved in in arc. It started at 7%, peaked at over 9% mid-year, then moved lower to its reading at 6.4% for the month of January. Upcoming CPI releases have the potential to further move markets.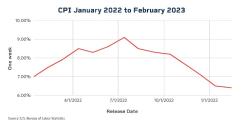
Importantly, as inflation was released and was higher than the Federal Open Market Committee (FOMC) expected, it began an interest rate lift off that has continued unabated. In January, the Fed slowed its hiking process, and recent events have significantly moved expectations for further hikes. For example, the CME Group Fed Watch tool estimated a much higher probability of a 50-bps hike than a 25-bps hike immediately following Congressional testimony from Fed Chair Jerome Powell on March 7. Following the Silicon Valley Bank failure and intervention from the FDIC and Federal Reserve, expectations moved strongly back to the 25-bps expectation.
In a recent conversation, one market participant put the rates movement into perspective – the five-day trading range of market expectations for the September 30-Day Fed Funds futures contract has been 5.705% to 3.525%. In comparison, the range in Fed Funds from January 2010 to December 2019 was 2.4%. We can see in the following chart the fast-changing expectations before the March 22 Federal Reserve meeting.
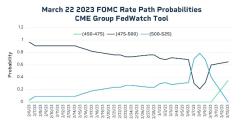
Source: CME Group. Data through March 16, 2023

By The Numbers
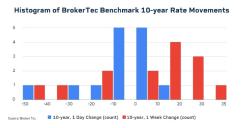
Using historic yield curve moves of the BrokerTec 10-year mid yield 3 p.m. close, the yield moves on the CPI release date and the subsequent one-week moves show dramatic market reactions. In general, as CPI was above 8%, interest-rate movements both one day and one week after release were significantly positive. Likewise, when CPI began to move lower into the 7% range, the interest rate movements were to the downside. However, the January CPI print came in higher than expectations and interest rates responded by moving higher, particularly over the next week as FOMC officials began to talk in more hawkish terms. Here is that same CPI chart with the change in 10-year BrokerTec benchmark rates for one day and one week.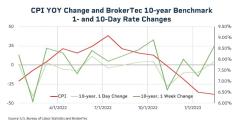
Converting those interest rate movements and plotting them in a histogram provides more insight to what happened in the interest rate market over the past year. The one-day interest rate movement appears to look somewhat normally distributed with rates moving lower. However, the one-week change looks much more skewed to higher rates. In general, higher rates provide for a more volatile interest rate environment. Assessing the movement in interest rate volatility during and after CPI releases unlocks some additional interesting insights.
Getting Volatile
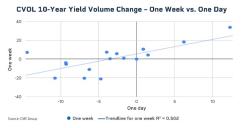
Assessing interest rate volatility can easily be done using CME Group CVOL on 10-year yield volatility. This index tracks the 30-day implied volatility using the deep liquidity in treasury futures markets.Using the same analysis for both one-day and one-week 10-year treasury movements via CVOL, a pattern becomes evident when plotted in a scatter chart. Over the prior year the movement in initial volatility during the first day has a decent R-Squared with additional interest rate volatility movements over the following week.
Below is the one-day 10-year treasury CVOL movement plot against one-week CVOL movement. Notice how the direction of the CVOL index for the one-day and the one-week are often quite similar. A simple linear regression line has been included in the plot as well as the R-Square value of 0.5. While there is not yet enough data to be statistically significant and history does not guarantee the future, an interesting pattern has developed with the data that we have thus far.