By Charles Hamieh, Shane Hurst, Nick Langley
Key Takeaways
- Infrastructure portfolio composition can be optimized for investor preferences, such as liquidity preference, choice of underlying asset risk exposure, sensitivity to short-term price volatility and opportunistic use of market mispricing and arbitrage.
- There is a wide range of returns and large discrepancies in valuation, both between listed and unlisted companies and within each group, suggesting the universes are complementary, while the underlying assets are similar.
- For listed infrastructure such as U.K. water and North American electric utilities, regulation underpins long-term returns while allowing for opportunistic return enhancement for specialist infrastructure investors.
For the most part, allocations to infrastructure have been directed toward private market transactions and unlisted infrastructure funds, with the aim of achieving stable long-term, inflation-linked returns.
Over the past seven years, the amount of funds flowing into this relatively young asset class has grown dramatically. This increasing demand for unlisted infrastructure assets has not been met by an equivalent increase in the supply of suitable infrastructure opportunities. According to Preqin, capital committed to private markets infrastructure funds (but yet to be drawn, commonly referred to as “dry powder”) more than doubled from 2015 to 2019 to US$212 billion, and by the end of 2021 topped US$300 billion. Already in 2022 further fundraisings in excess of US$90 billion have been announced or closed.
The listed infrastructure market, however, provides investors with a broad, deep and liquid range of infrastructure investment opportunities. As a result, listed infrastructure is an alternative option for capital deployment in this asset class. It also provides the investor with flexibility to choose or amend an investment horizon.
The Infrastructure Opportunity Set
The infrastructure opportunity set is large. Depending on how broadly infrastructure is defined, there is between US$20 trillion and US$50 trillion of infrastructure assets globally. Most of these assets are under public ownership and therefore not available to private investors. We estimate that, in a narrow definition, roughly US$10 trillion of global infrastructure assets are privately owned, of which listed infrastructure accounts for 70% or US$7 trillion of asset value (approximately US$3 trillion of equity value).There is sound evidence that the investable universes for listed and unlisted infrastructure are complementary, rather than substitutes.

First, they offer different subsector exposures (Exhibit 1):
- Community and social assets, such as schools, universities, hospitals and government facilities that help deliver social services.
- Regulated assets, such as water, electricity and gas transmission and distribution, for which a regulator determines the revenue a company should earn on its assets.
- User-pays assets, such as rail, airports, roads and telecommunication towers, which move people, goods and services throughout an economy and where pricing, volume and revenue are determined by how many people use the assets.
- Competitive assets, such as telecommunication and utility retailers.
Exhibit 1: Global Infrastructure Assets
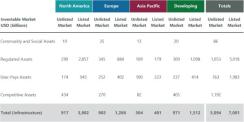
As of Dec. 31, 2021. Source: ClearBridge Investments, Bloomberg and Preqin. Measured by enterprise value. Total numbers may not add up due to rounding. Privately held assets that have not been transacted in the past 10 years are not considered “investable” due to their unavailability to private buyers.
Second, our assessment of the infrastructure asset class shows there are also meaningful differences in risk exposures for the listed and unlisted universes, which can lead to different observed performance (Exhibit 2). This further evidences that these universes are complementary, rather than substitutes. Different subsector and risk exposures allow investors in both listed and unlisted infrastructure the opportunity to improve portfolio construction efficiency and control unintended portfolio biases or risks.
Exhibit 2: Subsector Weightings of Listed and Unlisted Infrastructure Universe
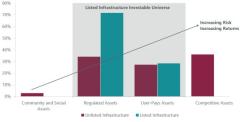
As of Dec. 31, 2021. Source: ClearBridge, Preqin. Measured by enterprise value. The Listed Infrastructure Investable Universe is the combination of the investment universes (updated on a quarterly basis) for each of ClearBridge Investments’ infrastructure strategies.
Regulation Underpins Long-Term Returns While Allowing for Opportunistic Return Enhancement
Whether an infrastructure investment is held in a listed or unlisted form, the key driver of asset-level risk and returns is regulation. The returns “allowed” by the regulator are a critical driver of long-term asset-level returns and the operating conditions or constraints imposed by the regulator are key ongoing risks to be managed or mitigated.Case Study: U.K. Water
Listed and unlisted U.K. water companies share the same regulator (the Water Services Regulation Authority, or Ofwat) and similar macroeconomic drivers, and regulatory allowed return on capital is the main driver of returns in this sector. While there is scope to outperform the allowed return
through operational skill, for the 2001–14 period the difference in operating profit (as a percentage of the regulated asset base) of the average listed company and average unlisted company was less than 0.5%. However, following the 2014 regulatory review (PR14) Ofwat followed policies intended to reward better- run companies. Ofwat now agrees on a series of operational and customer engagement benchmarks with companies and attaches financial penalties or incentives to the outcomes. For example, listed companies (representing three of the 10 large industry participants) have a range of tools to remunerate management, allowing some companies to strive for better execution and achieve better returns. This indicates an opportunity for active infrastructure investors to allocate to the better performers.
Exhibit 3: Return on Regulated Equity (RoRE, Post-Tax Real) 2014-2022
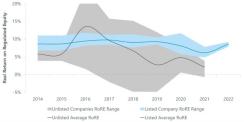
As of Aug. 25, 2022. Source: ClearBridge Investments, Ofwat and company announcements. The gray shaded area represents the range of returns from the best to worst unlisted company performer each year. The blue shaded area represents the range of returns from the best to worst listed company performer each year. The grey and blue lines represent the average return (smoothed) for the unlisted and listed companies. Results from 2014 and 2015 are average across the two years, as published by Ofwat. 2016–21 results are for each individual year, as published by Ofwat. The listed company results are as reported by the companies for FY21 and FY22.
As a result of the PR14 policies, the RoRE achieved by the water industry has become more volatile, with the range averaging approximately 14% during the
2014–21 period. Exhibit 3 demonstrates that the listed companies have achieved a more consistent return profile over the last nine years, averaging 8.6% real RoRE, some 2.3% (on average for the 2014–21 period) higher than the unlisted companies.
Return on equity (ROE), as reported by the companies, and the returns to equity holders (investors) are a function of the operating returns, capital structure and financing of the companies. The capital structures of many of the unlisted water companies reflect significantly higher debt and leverage than the listed water companies. For the unlisted companies, this may result in higher returns, but also higher volatility to those returns and greater financial risk.
Over the long term, the returns to equity holders reference the ROE reported by the companies and the ROE allowed by the regulator.1 Exhibit 4 indexes the allowed ROE, reported ROE and investor returns (income and capital) for the listed U.K. water companies for the 2002–22 period. The compounded company reported ROE2 has exceeded the regulator-allowed ROE by approximately 3.5% per annum, indicating that the companies are outperforming the regulator’s operating assumptions and agreed business cases. It is common around the world for regulators of essential service companies to set return benchmarks that the companies subsequently outperform. This is generally achieved through operational and/or financing efficiencies and promotes long-term benefits for both companies (investors) and ratepayers (customers).
Returns to equity holders (investors) over the period have exceeded company-reported ROE by a further 40 basis points per annum.
Exhibit 4: U.K. Water, Return on Equity (Post-Tax Nominal) FY 2001-2022

As of Mar. 31, 2022. Implied by regulated allowed returns (allowed ROE), compared with listed company DuPont ROE (reported ROE) and total returns (income and capital gain) received by investors, inclusive of net dividends (investor returns). DuPont ROE = Net Income/Tangible Assets x Total Capitalization/Total Debt. All Bloomberg reported measures (financial year data). Source: ClearBridge Investments, Bloomberg and Ofwat.
In the past 10 years, listed U.K. water companies have traded between a 2% and 35% premium to their regulated asset base, while private transactions have mostly occurred closer to a 30% premium to asset base. This has allowed opportunities for listed market investors to gain exposure to the U.K. water sector at (often) significantly more attractive entry prices.
With the average trading premium for listed U.K. water companies at 17% over the past 10 years and private acquisitions of these companies occurring at upwards of a 30% premium to asset base, we believe the two most likely outcomes for long-term holders of listed U.K. water are that the companies:
- Perform broadly in line with their peers and, given a lower entry price (valuation), investors earn a higher return on their investment than they would have with similar unlisted U.K. water companies; or
- Are taken private by an unlisted fund at an attractive exit valuation (Exhibit 5 shows a number of such transactions in the past few decades).
Exhibit 5: U.K. Water Sector Premium/(Discount) of Enterprise Value to Regulatory Capital Value (RCV), Market Trading and M&A Transactions
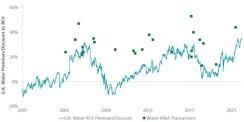
As of Dec. 27, 2021. U.K. Water RCV premium is the average estimated weekly enterprise value to RCV for Pennon, Severn Trent and United Utilities. Source: ClearBridge Investments, Bloomberg Finance.
U.K. water infrastructure illustrates the complementarity of listed and unlisted infrastructure universes. Despite the underlying assets of listed and unlisted companies being close substitutes, there can remain a wide range of returns and large discrepancies in valuation, both between listed and unlisted companies and within each group. This suggests conditions are in place to use listed infrastructure investments opportunistically for return enhancement while maintaining a similar exposure in underlying assets.
Case Study: North American Electric Utilities
North American electric utilities are regulated on a state-by-state basis but generally use a nominal allowed ROE approach. While there is generally no set regulatory period, either the company can initiate a regulatory review (if it is underearning its allowed ROE) or the regulator can initiate a review (if it believes the company is overearning). This regulatory regime, therefore, creates a direct relationship between the regulator-allowed ROE and the returns to equity holders (investors) of the companies.
Exhibit 6 indexes the allowed ROE, reported ROE and investor returns (income and capital) for the listed North American electric companies for the period 2001–21. The compounded company-reported ROE has exceeded the regulator-allowed ROE by approximately 30 basis points per annum, indicating that the companies are outperforming the regulators’ operating assumptions and agreed business cases. This is normal for many regulated utilities.
Returns to equity holders (investors) over the period lie between regulator-allowed ROE and company- reported ROE. The range of returns to equity holders versus the allowed and reported ROEs among the
42 companies in the study in any given year is significant. This again illustrates that while regulation underpins long-term returns, liquidity allows specialist listed infrastructure investors the ability to enhance infrastructure returns.
Exhibit 6: North American Electric Utilities, Return on Equity (Post-Tax Nominal) 2001–2021

As of Dec. 31, 2021. Implied by regulated allowed returns (allowed ROE), compared with listed company DuPont ROE (reported ROE) and total returns (income and capital gain) received by investors, inclusive of net dividends (investor returns). DuPont ROE = Net Income/Tangible Assets x Financial Leverage Ratio. All Bloomberg reported measures (financial year data). Source: ClearBridge Investments, Bloomberg Finance.
Listed Infrastructure Achieves Similar Returns but with More Flexibility
It is not surprising that returns at the asset level are similar for listed and unlisted infrastructure and heavily reliant on the returns allowed by regulators, given that the holding structure should not materially affect the cash flows at the asset level. However, investors are chiefly concerned with the achieved returns from their investment, rather than the returns at the asset level. How comparable are the long-term achieved returns for investors in listed and unlisted infrastructure?In order to evaluate this, we compared returns for the Preqin Unlisted Infrastructure Index (Preqin Index, a proxy for unlisted infrastructure funds) with returns for a broad global listed infrastructure index maintained by the Global Listed Infrastructure Organization (GLIO) (Exhibit 7).Exhibit 7: Listed Infrastructure vs. Unlisted Infrastructure, Global REITs, Global Equities

As of Dec. 31, 2021. Source: Global Listed Infrastructure Organization (GLIO) monthly total returns, Wilde/Preqin (unlagged), MSCI World Index monthly total returns, GPR 250 Index monthly total returns, OECD G7 CPI.
We offer several observations on Exhibit 7:
- While there is no material difference in returns over most medium to long-term time periods for listed and unlisted infrastructure, listed infrastructure clearly demonstrates the trade-off between liquidity and volatility.
- There can be a significant valuation lag between the listed and unlisted markets. It is evident that through the financial crisis in 2008, the unlisted funds continued to write-up the value of their assets. During this time the listed market had already corrected significantly. Valuations in the unlisted market only start to be reduced in late 2008 and early 2009. We note that in 2009 there was a significant drop in transactions (not pictured here), approximately 40%, likely due to the divergence between the price expectations of sellers and buyers. For this reason, the GLIO lags the results from the Preqin Index by seven months (estimated to be the average “valuation lag”).
- Listed infrastructure had very strong returns following the Global Financial Crisis (GFC) correction, reflecting the fact that the assets became undervalued during this period. Given that the underlying cash flows of the infrastructure assets did not materially change, the listed infrastructure assets recovered all of their losses within three years and continued to perform strongly after that.
- Listed infrastructure asset prices rose in late 2014 and early 2015 on the back of ongoing monetary stimulus and overly optimistic valuations in the U.S. pipeline sector in particular. This mispricing corrected somewhat in late 2015.
- The greater volatility of listed infrastructure was again evident in the reaction to the 2020 pandemic; however, listed and unlisted pricing did not show the long disconnect demonstrated during the GFC, likely due to the shorter recession.
Listed Strategy Implementation
Given that regulator-allowed ROEs underpin investor returns over the long term, investors can be confident in a long-term “beta” strategy that simply takes exposure to a broad “index” of infrastructure companies. Active managers may provide additional returns and/or lower volatility than the broader index strategy.In terms of achieving a beta exposure to the sector, Exhibit 8 demonstrates the relationship between the asset-level regulatory ROEs (where available, otherwise company-reported ROE) and investor returns from passive and active management of global listed infrastructure strategies.3
The base data for the regulated/company-reported ROEs is derived from ClearBridge’s current proprietary investment universe, which comprises all reasonably liquid companies that fit the ClearBridge definition
of infrastructure (based on the proportion of the business that is infrastructure and the “quality”4 of that infrastructure). As such, the universe composition differs from the listed infrastructure indexes and will likely be impacted by survivor bias, although it is not expected that this would impact the weighted ROE result materially.
As Exhibit 8 shows, from 2015, listed infrastructure indexes have underperformed both regulated/ company-reported ROEs as well as the top half (5th to 50th percentile) of active managers. Additionally, top-performing managers have provided “alpha” to investors over and above the asset level “beta” returns by investing in companies providing superior returns and by adjusting sector and/or regional weightings to better suit business and market cycles.
Exhibit 8: Listed Infrastructure Investable Universe ROE (Regulated/Company-Reported, Post-Tax Nominal) vs. Passive and Active Infrastructure Returns (Gross, in USD)
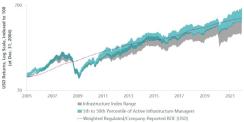
As of Dec. 31, 2021. In the calculation of ROEs, U.K. water and North American electric and gas as per regulator allowed (see Exhibits 4 and 6); other developed utilities and user-pays and emerging markets are as reported by the individual companies, filtered to remove one-off results. The local currency ROEs have been translated to USD using the annual difference in local currency- and USD-denominated total investment returns for the same weighted universe. To remove distortions as the universe has developed, the ROEs and returns are weighted (and reweighted annually) by the following sectors: U.K. water 5%; U.S. electric and gas 35%; other developed utilities 23%; developed user-pays 30%; emerging markets 7%. This broadly matches the market cap weighting of the listed infrastructure indexes. The index range uses only publicly available infrastructure indexes. A wide range of performance outcomes exists, driven by each particular index’s composition. Source: ClearBridge Investments, Bloomberg Finance, eVestment.
Conclusion
We believe to take advantage of the infrastructure opportunity investors require a detailed understanding of the underlying assets. Focusing on underlying assets in listed infrastructure markets allows investors to capture opportunities that arise when equity markets misprice infrastructure assets due to a focus on short-term information. Meanwhile, regulatory and contractual frameworks underpin the cash flows and determine long-term outcomes.Listed infrastructure offers a broad and deep investment universe of high-quality infrastructure stocks and a complement to unlisted infrastructure for capital deployment in this asset class. Investors prioritizing the flexibility to move among sectors, regions and market cap spectrums should be well-positioned to make the most efficient use of the listed infrastructure market. Listed infrastructure also provides investors with the flexibility to choose or amend their investment horizon and tailor liquidity preferences, sensitivity to short- term price volatility and choice of underlying asset risk exposure. It has performed consistently with unlisted infrastructure over the longer term, reflecting the stable and inflation-linked performance characteristics of the underlying assets and demonstrating its value as a complement to unlisted infrastructure allocations.
Further, the use of active management may allow investors to better manage risk and return outcomes, including achieving higher returns than those provided by passive or “beta” exposures. Should investors’ risk tolerance allow for more concentrated portfolios, potentially with higher volatility, then higher returns may be available as active managers take advantage of equity markets’ mispricing of infrastructure assets.
End Notes
1 Ofwat as the U.K. water industry regulator determines a real allowed return on assets (and an implied real post-tax return on equity). ClearBridge Investments has calculated an implied nominal return of equity allowed based on Ofwat’s implied real post-tax return on equity and the retail price index (RPI) as an escalator.
2 Given the lack of book equity, a function of the manner in which the companies were privatized in 1990, a modified DuPont analysis has been undertaken to determine the reported ROE, as described in Exhibit note.
3 The analysis is incepted as of December 31, 2004, when the first dedicated listed infrastructure active managers emerged.
4 Infrastructure quality is assessed based on a scorecard approach with qualitative ratings for the company’s operating environment and predictability 2 of pricing and volumes over time.