Blu Putnam, CME Group
AT A GLANCE
- Corporate profit growth is at risk from rising producer prices and accelerating compensation costs
- The share of corporate profits in nominal GDP is likely to decline from the current elevated level
The outlook for corporate profit growth and price-earnings ratios could not be more fragile. It’s an open question as to whether equity markets have fully discounted the possibility of eroding profits, and a rising hurdle rate (that is, higher bond yields) could challenge price-earnings ratios. Here are the three factors to watch.
Producer Prices
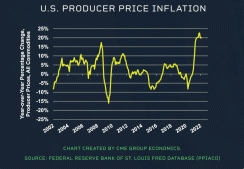
Many companies in the goods producing sector are facing sharply higher input costs. The pressure from input prices started in 2021, but many companies were able to draw on inventories accumulated before prices started their climb. That will not work in 2022. Producer price inflation has surged to the 20% territory, growing more than twice as fast as consumer price inflation. It is essential to monitor developments in producer prices to evaluate the potential for eroding profit margins.
Tight Labor Market
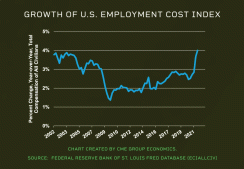
The U.S. is seeing rising compensation costs for all employees, not just lower-paid hourly workers. Even though total compensation costs are still growing less than consumer price inflation, many analysts expect labor cost pressures to only accelerate as abundant job openings allow workers to shop for increased pay that can help them keep up with inflation.
The result is that the share of labor income from corporate revenue is likely to increase, while the share of corporate profits in nominal GDP is likely to decline from the current elevated level.
Rising Treasury Note and Bond Yields
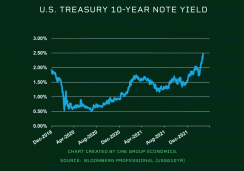
Rising yields are often paired with declining price-earnings ratios because one is using a higher yield to put a present value on future cashflows.
Rising input prices, increased labor costs, and higher bond yields – it’s a trifecta contributing to equity market fragility and volatility.
Read more articles like this at OpenMarkets


