There’s good reason that the FAANG stocks – for Facebook, Amazon, Apple, Netflix, and Alphabet (still often referred to as Google) – have dominated investor’s attention for years. Even amid stumbles and controversies, their values have kept soaring (in some cases by over 5,000% in the last decade). Today, in the autumn of 2021, the FAANGs account for roughly one-fifth of the market capitalization represented by the S&P 500 index and nearly one third of the total capitalization of the Nasdaq 100.
But many market analysts believe that the extreme influence FAANGs exert in portfolios and the markets at large is increasing systemic risks – and they’re warning institutional investors to give greater scrutiny to their exposure to these U.S. tech giants.

FAANGs can seem bulletproof
A chorus of market pundits expected the FAANG stocks to trend earthward as the pandemic’s effects lifted and people worldwide emerged from their digital cocoons in 2021. “But due the Delta variant and other factors, their expected rotation from growth to value has not really taken off – and this has reinforced a perception that, to some degree, these stocks are bulletproof,” says Cameron Brandt, Director of Research for EPFR, a division of Informa Financial Intelligence.Even many conservative institutional investors have renewed optimism in the FAANGs, Brandt adds, in reasoning that some enduring increases in the use of online services and remote working haven’t been properly priced into valuations and the stocks may settle at higher levels than previously thought.
Vast inflows from passive funds
The growing number and size of passively managed investment vehicles that flow cash to the FAANGs are a key factor in their prolonged rise and growth in AUM prominence, says Brandt. “As long as valuations for the FAANG stocks remain high, funds steadily allocate cash to them, and this becomes a self-reinforcing loop,” he says.EPFR performs deep analysis on these passive inflows to FAANGs and other securities with databases that track the flows and allocations data from 135,000 mutual funds and ETF share classes, from institutional and retail sources, representing over $50 trillion of fund flows. “Analysis using this data can get very granular, going down to the shock level, to help investors identify risks, assess their real magnitude and then craft strategies, models and other tools to profitably navigate those risks,” says Brandt.

So just how much cash are passive funds pumping into FAANGs? “Our databases show there’s been a great increase in inflows from passive investment tools into technology funds over just the last two years, and we can track the amount of that flow going into individual stocks,” says Sayad Baronyan, Director of Quantitative Research at EPFR. Their analysis shows Apple, Amazon and Netflix have respectively received $12 billion, $7.5 billion, and $2 billion passive-funds inflows alone since the beginning of 2020. “These inflows have added to the FAANG’s momentum in ways that institutional investors couldn't ignore,” Baronyan adds.

A cornerstone of portfolios
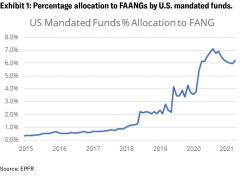
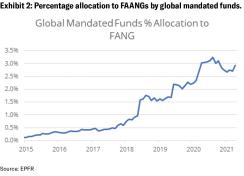
FAANGs have grown rapidly as a percentage of AUM in portfolios, says Baronyan. For example, US-mandated equity funds had about 2% of their total AUM sitting in FAANG stocks in 2008, and now it's up to 10%, he explains. “For global mandated funds, the total AUM sitting in the FAANG stocks was about 1.5% back in 2018, and It's now up to nearly 5% according to EPFR database figures,” says Baronyan. “These are significant numbers.” (See Exhibits 1 and 2 below).While their performance has certainly resulted in passive funds to increase allocations to them, “this growth can also be attributed to the increasing number new passive mutual funds and ETFs offered around these technology stocks which are simply chasing the same returns,” says Baronyan. “Importantly, this activity is not mirrored in the active funds, which have much less AuM sitting in FAANGs and are arguably the most informed and most competent people when it comes to forming an opinion of where FAANG stocks should be.”
EPFR’s data shows that actively managed funds were only allocating 82 billion to FAANGs as of October 2021, while passively managed funds allocated more than $790 billion.
As the FAANGs increasingly become portfolio cornerstones, it’s a breeding ground for volatility and systemic portfolio risk, says Baronyan. “For one significant example, any negative news or unexpected event around FAANGs might cause systemic disruption to the entire asset management industry.”
Risk #1: An ominous domino effect
Most worrisomely, a single FAANGs misfortune could trigger a dangerous cascade. “The weight of FAANG stocks in portfolios is reaching a point where there would almost certainly be a systematic knock-on effect if one of them tanks badly,” says Brandt. The risk is compounded by the extensive footprint these companies have in funds, making them ‘systematic’ holdings within the fund management industry, he explains. EPFR’s analysis shows that Amazon has the strongest presence in U.S. funds (see Exhibit 3).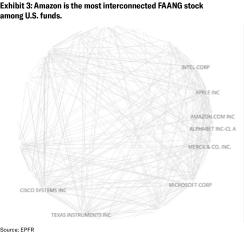
Risk #2: Competition from China’s tech stocks
Many analysts believe that Chinese tech companies, such as Alibaba and Tencent, are reaching levels of scale and competence that will threaten the FAANGs’ dominance in their spaces, says Brandt. Further, China’s recent regulatory crackdowns on their own technology heavyweights are being viewed positively; “China’s actions are now actually being talked about as a blueprint for the management and regulation of the big online companies,” Brandt explains. “And if the Chinese model is the one that European and U.S. regulators draw from, then there’s strong reason to think the valuations of FAANG stocks are not going to keep going the way they have been for several years.”At minimum, the maturing of these Chinese tech giants is a signal that the FAANG’s ongoing market dominance can no longer be assumed. “Institutional investors looking at our data are considering taking a bit of a pullback now from the FAANGs – especially in light of the market's judgment that Chinese tech stocks won’t be quite as badly hobbled as their current valuations suggest and may indeed start to both compete directly with the FAANGs and take up a bigger slice of global indexes where they’re both listed,” says Brandt.
Risk #3: Loss of status as SRI-ESG plays
A large portion of the passive inflows FAANGs receive stem from mutual funds and ETFs vehicles trying to satisfy environmental or socially responsible mandates or motivations, Brandt adds. Some funds choose FAANGs for strong governance perspectives, while others choose them for sustainability or climate perspective. In fact, EPFR’s data shows that about 20% of the total flows coming into FAANG stocks in the last 18 months have been sourced by the funds’ SRI-ESG teams. The proliferation of specific SRI-ESG funds is a factor, too. “SRI-ESG funds are pulling in up to $6 billion of fresh money every week, and new ones are popping up like mushrooms,” Brandt explains.However, the progressive support FAANGs publicize for SRI-ESG concerns is often inconsistent with the realistic impact of their massive operations – and perhaps their internal profit motivations to a problematic extent, as a whistleblower and leaked documents from Facebook emphasized earlier this year. “So far, they’ve done a relatively good job of keeping SRI-ESG factors in soft focus,” say Brandt. “I like to say that somehow they keep getting people to look at the Google campus rather than the Amazon warehouse.”
But harder scrutiny is likely coming soon and finding SRI-ESG problems – that could cause this portion of flows from passive funds to dry up – won’t be difficult, says Brandt. “You don't have to kick the tires hard to find operational aspects of these companies that could trigger a very sharp backlash in the SRI-ESG movement in a short period of time,” he explains. The energy output of the server farms could do it alone, he argues, as the criticism of the crypto industry shows.
Using EPFR analysis to manage FAANG risk
“While investors need to manage the risks from their exposure to FAANGs, they also don't want to miss out on what has been a reliable rocket fuel for a portfolio, and our data allows modelling that can generate alpha on a quarter-to-quarter cycle,” says Brandt. “The consistency and granularity of our data has led us to develop increasingly sophisticated momentum and switch models, and in the long term these will allow institutional investors and managers to make risk adjustments that can offer extremely important advantages,” Brandt says.He also emphasizes that the cleanliness of EPFR’s data offers investors greater consistency and timeliness (with a shorter time lag) in their analysis compared to other sources. “The EPFR database has now run since 1995, and it tracks a corner of the portfolio capital universe that I would argue is a very pure and clear subset – the structure and governance of mutual funds,” says Brandt. “We've seen the rise of ETFs, and the structure of mutual funds and ETFs are very consistent across time and across geographies, so this makes comparative analysis and modelling very effective.”
For one example of timeliness, he says, tracking sector funds down to the stock level shows relative appetite for technology versus other key groups on a weekly and daily basis. “We have cuts of the data that are actually actionable based on the previous day's flows and numbers, and investors have the ability to tell a straightforward story with those data,” says Brandt. “EPFR's data provides a steady stream of inflection points, giving investors timely warning when some of the assumptions that they're basing their appetite for FAANG stocks upon aren't holding up.”
From a quantitative perspective, EPFR's data has two important points, says Baronyan. “One is risk appetite, which offers 30,000-foot view on what's happening with fund flows in every asset class and sector in every country in the equity market, showing where money is flowing and interest is increasing or decreasing,” he explains. “The other is positioning, showing what fund managers are doing with those flows in their portfolios with a data set that has country, sector and stock allocations.”
Following are three specific strategies institutional investors can apply by using EPFR’s analysis.
Mapping allocation against earnings surprises
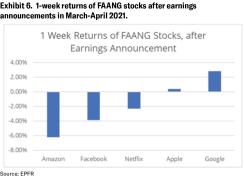
To help predict a FAANG’s near-future trajectory, EPFR maps changes in active-fund allocation against subsequent surprises in quarterly earnings. “This model has a fairly high success rate in terms of telling you where to put your eggs on a short-term basis,” says Brandt. “Institutional investors armed with our data have used different timing in their week-to-week and month-to-month pullbacks and additions than the general market; for example, they were recently forewarned that predicted value-to-growth rotation didn't have nearly as much momentum as earlier modelling suggested.”Exhibits 4 to 6 illustrate this strategy. As seen in the first chart (Exhibit 4), all FAANGs except Netflix beat their earnings expectations in Q1 of 2021. “A close follower of our EPFR’s flows data would have seen this expectation building among active mutual fund managers in March,” says Brandt.
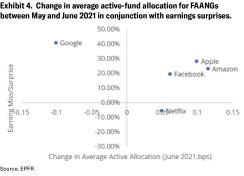
Exhibit 5 shows a nearly linear relationship between earning expectations and the change in active allocations for FAANG stocks during March.
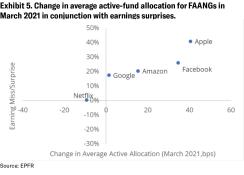
Google is the only FAANG stock that saw its active-fund allocation decrease and then beat its predicted earnings. Significantly positive returns followed for Google, as the positioning was lighter compared to other FAANG stocks and the positive earnings surprise was strong.
Set up review triggers
Brandt also recommends that institutional investors set up triggers to review their exposure to FAANGs. “For one, I advise keeping eye on the ratio between active and passive management of the FAANG stocks in funds, to watch for any clues of underweighting on the active management side,” he says.While specific figures will vary in different economic conditions, “for the sake of argument, you couple say that if the average active allocation to FAANGs dropped below 80% of the general allocation for passive funds, that should trigger analysis,” says Brandt.
Watch for crowding
Classic securities crowding – when too many shares of one popular stock are owned by too few large holders – can increase volatility and systemic risk. As major holders continue to increase their allocations, FAANGs are inching closer to being crowded, says Brandt. “They’re not in the danger zone yet, but we’re keeping a close eye on this,” he says. “We have a daily dashboard now that looks at this measure.”Kicking tires, not overreacting
“Effective risk management is kicking the tires on your assumptions, not overreacting and saying the sky is falling,” says Brandt. The fearsome power FAANGs wield on portfolios and financial markets makes over-reacting to negative (or positive) analysis particularly likely and concerning. But the valid threats looming for these five stocks – including seemingly stretched valuations, growing footprints in funds, expanding Chinese competition, and increasing possibility of an SRI-ESG backlash – are making it more critical than ever for institutional investors to implement effective, evidence-based, defensible risk-management strategies that won’t cause them to lose out on the invaluable returns that FAANGs may continue to provide.“Utilizing the full range of our EPFR’s capabilities will give institutional investors timely signals that alert them when they need to revisit their investment case for FAANGs – and, just as importantly, will tell them when rest of the market is overreacting,” says Brandt.
Learn more about using EPFR’s research to unlock new opportunities.