Institutional investors have a powerful role in supporting the transition to a low-carbon economy. Importantly, they have several mechanisms to align their portfolios with the goals of the Paris Agreement, the international treaty that has prompted many asset owners, asset managers, corporations, and countries to establish net zero greenhouse gas emissions targets.
Of the many options available to investors, real assets stand out as particularly effective. While institutional investors have long known of the traditional benefits1 that real assets provide to a portfolio (including diversification, inflation hedging, yield and liability matching), few realize that they could provide a cost-effective solution to decarbonizing a portfolio.
Real assets offer scalable, low-carbon investment opportunities and natural climate solutions strategies that increase carbon storage or avoid greenhouse gas emissions. In fact, a recent research paper from Nuveen (Think carbon optimization: Trade-offs between risk, return and net zero carbon) shows that allocating 20% to real assets can achieve a net zero carbon intensity while improving returns.
Using real assets to align with the Paris Agreement
The goal of the Paris Agreement is to limit global warming to well below 2 degrees Celsius (ideally no more than 1.5°C) compared with pre-industrial levels. Institutional investors can align their portfolios with this goal in a number of ways, including divesting from carbon-intensive sectors, increasing allocations to carbon-efficient or low-carbon investments, and investing in climate solutions that remove CO2 from the atmosphere.They can use traditional portfolio construction tools to develop a decarbonization strategy, adapting the standard optimization model to include the carbon intensity characteristics of real assets. This allows them to optimize portfolios across three dimensions (risk, return and carbon intensity) and to understand what trade-offs may be required.
At the macro level, real assets can provide over one-third of emissions reductions needed by 2030 to limit global temperature increases under 2°C.2 They can accomplish this by:
- producing more timber and agricultural commodities on less land;
- reducing emissions through efficient operating practices; and
- sequestering and storing carbon in soil and trees.

These higher impact strategies may also generate verified forest carbon offsets in some cases. Projects must meet either a voluntary or compliance standard with mechanisms for monitoring, reporting and verification to help ensure credits are real, additional and permanent. Credits generated from timberland or farmland investments can be monetized to increase financial returns, or used to balance emissions from another part of the portfolio.
Growing demand for natural climate solutions will drive investment and revenues in land-based real assets. The reforestation and afforestation market is expected to produce $2.8T in revenues through 2050, while global estimates for yield-enhancing technological investments in agriculture total $20T from 2015 – 2050.4
Risk, return and carbon profiles of traditional and real assets
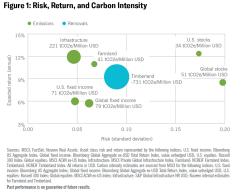
Not all asset classes are created equal when it comes to carbon intensity. They exist along a spectrum.Figure 1 plots risk and return for a range of asset classes, with circles representing the asset class’s carbon intensity. (For this analysis, carbon intensity is defined as Scope 1 and 2 net CO2 emissions divided by million USD invested.)
The risk-return profile of traditional asset classes spans the spectrum of lower risk and return for fixed income to higher risk and return for equities. Real assets offer attractive risk-return characteristics within this range, providing higher returns than fixed income and lower risk than stocks. However, the risk of real assets may be understated as they are private market asset classes with fewer data points than publicly listed assets.
In terms of carbon intensity, infrastructure is the largest net emitter among real assets. Farmland has a considerably lower carbon footprint, while timberland is net negative with the ability to remove carbon from the atmosphere. Stocks and fixed income are also relatively low – but it is worth noting that stock and bond indices comprise all sectors of the economy, which vary greatly in carbon intensities. For example, the utilities sector will likely have carbon intensities similar to that of private infrastructure, while the technology sector will likely have lower carbon intensities.
Note: All carbon intensities include scope 1 and 2 emissions and exclude scope 3. Timberland and farmland emissions exclude farm and forest management activities which are considered scope 3. Timberland removals are representative of average annual change in forest carbon stock for a portfolio that includes a mix of sustainable forestry and improved forest management strategies. Improved forest management strategies exhibit significant net removals whereas sustainable forestry strategies feature stable carbon stocks and do not have any net removals. Removals for improved forest management strategies are calculated by converting verified carbon credits of Nuveen-managed/administered properties into an annual rate of change in forest carbon stock. These rates of removals are not perpetual and may change over time as volume growth cannot exceed rate of harvest (and/or decomposition) perpetually.
The risk-return characteristics of the timberland portfolio from which carbon intensities are estimated may not exhibit that of NCREIF Timberland Index which includes primarily sustainable forestry strategies. The risk-return characteristics of the farmland portfolio from which carbon intensities are estimated may not exhibit that of NCREIF Farmland Index. The risk-return characteristics of the S&P Global Infrastructure Index from which carbon intensities are calculated may not exhibit that of the MSCI Private Global Infrastructure Index.
Lack of accounting standards adds risk
Standardized accounting methods for emissions and removals are critical to calculate a portfolio’s carbon intensity and advance toward net zero targets. However, such global standards don’t exist yet, which means the choice of carbon metrics is a source of uncertainty and risk. Industry organizations are addressing this issue:
- The Financial Stability Board’s Task force on Climate-related Financial Disclosures (TCFD) is developing consistent climate-related financial risk disclosures for use by companies, financial institutions and banks.
- The Partnership for Carbon Accounting Financials (PCAF) developed the Global GHG Accounting and Reporting Standard for the Financial Industry. It doesn’t address land sector removals, however.
- The GHG Protocol is drafting carbon accounting guidance for land sector and removals guidance, which is expected to be aligned with the Science Based Targets Initiative (SBTi) and be incorporated into PCAF’s standard. Nuveen’s timberland and farmland managers are pilot testing the GHG Protocol Land Sector and Removals Guidance.
Adapting the standard model to include carbon
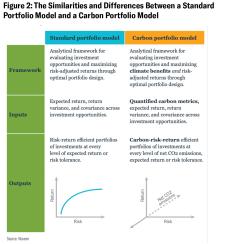
A carbon portfolio optimization framework can help investors understand the trade-offs between risk, return and carbon intensity across different investment types, and it can be applied to a multi-asset class portfolio.The model begins with a framework similar to the standard portfolio model (Figure 2). It defines the set of all possible investment opportunities an investor could allocate to across the capital spectrum, including traditional asset classes and private real assets. Each is defined by geography, management strategy, business model or product. For natural resources, this can also be by crop type or tree species.
As with the traditional portfolio optimization model, the unique investment profile for each opportunity includes details such as expected return, return variance and covariance with other opportunities in the universe.
This shows that the solution to the optimization problem is an efficient frontier, also similar to the standard portfolio model – but instead of optimizing for just two variables (risk and return) it adds a third (carbon intensity). As such, the efficient frontier becomes a three-dimensional surface. Every point along the carbon efficient frontier is an optimal portfolio investment that maximizes return for a given level of risk and carbon intensity.
Notes on model and results: The results from this modeling exercise should be considered broadly illustrative and not specific investment recommendations. Data limitations, such as the relatively short time series, self-reporting and a smoothing effect from periodic appraisals, are likely to understate actual volatility of private real assets returns. Additionally, carbon accounting standards continue to improve and evolve, which will inform carbon intensity metrics for both modeling and performance toward climate commitments. Traditional mean-variance optimization has well-known drawbacks that are not tied to a specific asset class, including the assumption that returns are normally distributed and reliance on historical returns that cannot predict future results.
Optimizing for carbon with real assets: Three portfolio scenarios
How do real assets impact the carbon intensity of a portfolio of stocks and bonds? This has been examined closely.5 We’ll explore three different portfolio scenarios in answering this question.Portfolio 1: Improved returns, but mixed effect on carbon
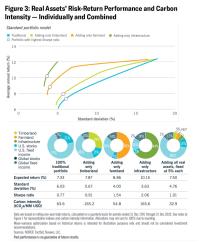
In Figure 3, efficient frontiers show the impact of adding farmland, timberland and infrastructure individually to a stock and bond portfolio. The table also shows the impact of combining all three categories. (In this example, we constrained real assets to 15%, divided evenly at 5% in each.)
Adding real assets improved the risk-adjusted returns but had a mixed effect on carbon intensity. Adding timberland and farmland reduced carbon intensity, whereas adding infrastructure increased carbon intensity.
Additional details:
- Each category of real assets increased returns, with similar or lower levels of risk, resulting in higher Sharpe ratios.
- The addition of timberland to a traditional portfolio produces the greatest reduction in carbon intensity.
- The addition of infrastructure to a traditional portfolio produced the greatest increase in Sharpe ratio.
Portfolio 2: Real assets-only portfolio, increasing timberland to achieve net zero
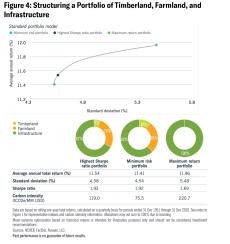
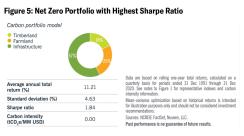
In a portfolio consisting only of private real assets, infrastructure and farmland dominated from a risk-return perspective (Figure 4). However, achieving a net zero portfolio required a greater allocation to timberland (with its net negative carbon profile) than indicated by the traditional optimization model (Figure 5).
Solving the carbon portfolio optimization model for net zero gives a Sharpe ratio maximizing portfolio that includes 18% allocation to timberland and a 57% allocation to infrastructure. This is the optimal net zero portfolio, achieving the target carbon intensity most efficiently.
Additional details:
- The most risk-efficient portfolio was dominated by infrastructure at 67%, but also included 28% farmland and 5% timberland, benefitting from low correlations among the categories.
- The lowest-risk portfolio reduced infrastructure exposure to 62%, held farmland constant at 28% and increased timberland to 10%.
- The highest-return portfolio consisted of 100% infrastructure, reflecting higher returns and lower volatility compared to timberland and farmland.
- Overall, the most efficient real asset portfolio generated much higher risk-adjusted returns than the most efficient combination of traditional stocks and bonds. However, the highest Sharpe ratio real assets portfolio also had twice the carbon intensity of the stock and bond portfolio.
Portfolio 3: Real assets aid net zero in institutional portfolio
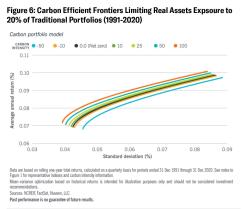
This scenario (Figure 6) shows that by allocating 20% to real assets, institutional investors can achieve a net zero or even net negative portfolio—while improving performance.
Real assets are expected to continue their recent steady growth. Estimates of alternative exposure for institutional investors vary from 16% for a “typical” institution to 26% for pension plans, to more than 50% for U.S. foundations.6 Institutions are increasing exposure to alternatives to generate more income and risk-adjusted returns, dampen volatility, and meet needs such as portfolio decarbonization.
The carbon portfolio model can determine two things: 1) if it is feasible to achieve a net zero institutional portfolio through allocation to real assets when that exposure is limited to 20%; 2) the allocation required across timberland, farmland, and infrastructure to achieve net zero most efficiently without sacrificing risk-adjusted returns.
Additional details:
- The net zero portfolio with the highest Sharpe ratio has a 9% allocation to timberland, 8% to farmland and 4% to infrastructure (Figure 7).
- Overall, the most efficient net zero portfolio generated much higher risk-adjusted returns than the most efficient combination of traditional stocks and bonds (see the 100% traditional portfolio in Figure 3) and drove portfolio carbon intensity down from 63.6 tCO2e/MM USD to zero.
- The net zero portfolio with the highest Sharpe ratio outperformed other net zero portfolios by nearly 70% more risk-adjusted return.
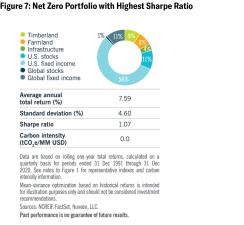
Combing real assets with traditional stocks and bonds can achieve net zero emissions…
…but only one portfolio maximizes the Sharpe ratio. As specified in Figure 7, the optimal net zero portfolio includes a mix of timber, farmland, infrastructure, stocks, and bonds.
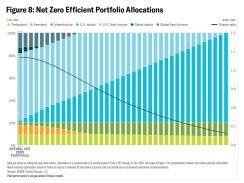
Figure 8 describes the portfolios along the net zero efficient frontier.
Additional details:
- Across the net zero efficient frontier, portfolios include a stable allocation to timberland, which serves as the source of negative emissions that balances positive emissions from other allocations (such as infrastructure).
- Given the above, all portfolios include a positive allocation to infrastructure – indicating there’s no need to divest from this relatively carbon intensive asset class to achieve net zero.
- The optimal net zero portfolio achieves the emissions target most efficiently, suggesting that climate targets need not reduce risk-adjusted returns. It is important to note, however, the results also suggest that avoiding material trade-offs to achieve net zero are driven largely by the inclusion of timberland (which can deliver net removals while also offering compelling risk-adjusted returns).
Understanding the trade-offs in reducing carbon
Our analysis provides a framework for incorporating carbon metrics and climate targets into portfolio allocation decisions, and for optimizing across risk, return and carbon intensity. But the crux of our research seeks to help investors understand what trade-offs may be required in optimizing financial performance and climate objectives.The analysis shows that a net negative institutional portfolio can be achieved by increasing allocations to low-carbon intensity private real assets, such as timberland and farmland.
This research shows that unconstrained by asset allocation limits and carbon intensity, infrastructure tended to dominate timberland and farmland, based on historical returns. The resulting large allocations suggested by the portfolio optimization model require practical constraints to address availability, prudent diversification and liquidity needs.
That said, even adjusting for these features, the modeling exercise showed that infrastructure still had a role to play in a net zero portfolio despite its relatively high carbon intensity. This was at a lower level than when unconstrained and required an increased allocation to timberland.
There’s a strong case for diversifying traditional stock and bond portfolios with multiple categories of real assets within realistic limits. A combined allocation of 20% significantly improved portfolio risk-adjusted returns and was sufficient to achieve a net zero carbon intensity.
Learn more about using real assets to achieve net zero.
1 Busby et al. Resiliency and diversification from uncorrelated market exposure, Nuveen, May 2021. The real assets analyzed were farmland, timberland, and real estate.
2 Griscom et al., 2017; Bastin et al., 2019; Busch et al., 2019; Fargione et al., 2018. The Nature-Based Solutions for Climate Manifesto, developed for the UN Climate Action Summit, 2019.
3 Griscom et al., 2017; Bastin et al., 2019; Busch et al., 2019; Fargione et al., 2018. The Nature-Based Solutions for Climate Manifesto, developed for the UN Climate Action Summit, 2019.
4 Vivid Economics and Energy Transition Advisers, Climate change: Preparing for an Inevitable Policy Response, May 2020
5 Busby and Jun, Think carbon optimization: Trade-offs between risk, return and net zero carbon, Nuveen, November 2021.
6 Sources: Natixis 2021 Institutional Outlook Survey for typical institutional investor allocation; Blackrock Alternative investments in modern portfolios for pension plan data, Financial Times ‘Game over’: Investors hunt for new model after years of broad gains, 02 June 2021, citing the National Association of College and University Business Officers, for U.S. foundation data.
Investing with Nuveen
Nuveen offers solutions for a range of institutional investors. We provide investors access to liquid and illiquid alternative strategies, such as real estate, real assets (farmland, timber, infrastructure), private equity and debt, in addition to both traditional and fixed income assets. Access to these strategies includes pooled funds, separate accounts and co-investment opportunities. Our heritage as a pension fund means we understand the challenges other like-minded investors face. We have successfully been investing through market cycles for more than 100 years, for both ourselves and our investment partners. We work closely with our clients to understand their requirements and develop forward-thinking investment opportunities. Short-lived market cycles, evolving investor needs and sustainability pressures bring significant opportunities and challenges. We focus on three investor objectives across all of our client solutions:- Generating income and capital growth
- Managing risk in a world of ongoing uncertainty
- Managing assets cost-effectively via optimal scale and access
Sources
The statements contained herein are based upon the opinions of Nuveen and its affiliates, and the data available at the time of publication of this report, and there is no assurance that any predicted results will actually occur. Information and opinions discussed in this commentary may be superseded and we do not undertake to update such information. This material is provided for informational or educational purposes only and does not constitute a solicitation in any jurisdiction. Moreover, it neither constitutes an offer to enter into an investment agreement with the recipient of this document nor an invitation to respond to it by making an offer to enter into an investment agreement. This material may contain “forward-looking” information that is not purely historical in nature. Such information may include, among other things, projections, forecasts, estimates of yields or returns, and proposed or expected portfolio composition. Moreover, certain historical performance information of other investment vehicles or composite accounts managed by Nuveen has been included in this material and such performance information is presented by way of example only. No representation is made that the performance presented will be achieved by any Nuveen funds, or that every assumption made in achieving, calculating or presenting either the forward-looking information or the historical performance information herein has been considered or stated in preparing this material. Any changes to assumptions that may have been made in preparing this material could have a material impact on the investment returns that are presented herein by way of example. This material is not intended to be relied upon as a forecast, research or investment advice, and is not a recommendation, offer or solicitation to buy or sell any securities or to adopt any investment strategy. The information and opinions contained in this material are derived from proprietary and non-proprietary sources deemed by Nuveen to be reliable, and not necessarily all-inclusive and are not guaranteed as to accuracy. There is no guarantee that any forecasts made will come to pass. Company name is only for explanatory purposes and does not constitute as investment advice and is subject to change. Any investments named within this material may not necessarily be held in any funds/accounts managed by Nuveen. Reliance upon information in this material is at the sole discretion of the reader. They do not necessarily reflect the views of any company in the Nuveen Group or any part thereof and no assurances are made as to their accuracy. Past performance is not a guide to future performance. Investment involves risk, including loss of principal. The value of investments and the income from them can fall as well as rise and is not guaranteed. Changes in the rates of exchange between currencies may cause the value of investments to fluctuate.
A word on risk
This material is presented for informational purposes only and may change in response to changing economic and market conditions. This material is not intended to be a recommendation or investment advice, does not constitute a solicitation to buy or sell securities, and is not provided in a fiduciary capacity. The information provided does not take into account the specific objectives or circumstances of any particular investor, or suggest any specific course of action. Financial professionals should independently evaluate the risks associated with products or services and exercise independent judgment with respect to their clients. Certain products and services may not be available to all entities or persons. Past performance is not indicative of future results.
Economic and market forecasts are subject to uncertainty and may change based on varying market conditions, political and economic developments. As an asset class, real assets are less developed, more illiquid, and less transparent compared to traditional asset classes. Investments will be subject to risks generally associated with the ownership of real estate-related assets and foreign investing, including changes in economic conditions, currency values, environmental risks, the cost of and ability to obtain insurance, and risks related to leasing of properties.
Real Asset investments may be subject to environmental and political risks and currency volatility. Nuveen provides investment advisory solutions through its investment affiliates.
GWP-1922000PF-O1221X