By Eric Leininger, CME Group
AT A GLANCE
- A confluence of fiscal and monetary hot spots could mean heightened risk and volatility in interest rate markets.
- Given U.S. spending needs, estimates suggest that the Treasury may have difficulty servicing its debt payments beginning in late October or November.
The Debt Ceiling
The U.S. Treasury total borrowings are restricted to $28.5 trillion, according to the Congressional Budget Office. Since 1960, Congress has acted 78 separate times to permanently raise, temporarily extend, or revise the definition of the debt limit. Given spending needs by the U.S. government, various estimates suggest that the Treasury may have difficulty servicing its debt payments beginning in late October or November. To combat the reduced ability to borrow, in early August the Treasury announced a series of “Extraordinary Measures” to prevent “defaulting on its obligations.” These include suspending payments to some pension accounts and a reduction of issuance of certain intergovernmental agency securities.Nevertheless, the market has begun pricing of a small premium, as can be seen in T-Bills and U.S. EUR Credit Default Swaps (CDS).
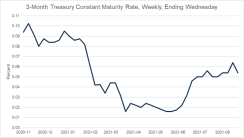
Source: Board of Governors of the Federal Reserve System (US), retrieved from FRED, Federal Reserve Bank of St. Louis, August 30, 2021.
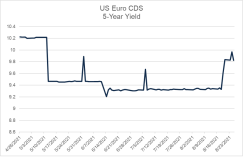
Source: Bloomberg

Treasury futures can help navigate this potential issue to maintain correct risk management. The construct of Treasury futures baskets is large and made up of numerous issuances.
Another area of pricing to watch is spreads between U.S. and banking. If stress continues to build for US funding, investors can monitor and manage risk using CME Group futures on SOFR (US Treasury funding) and the new CME Group BSBY futures contract (bank funding).
Finally, the new Micro Treasury Yield futures contract ‒ that has final settlement to the BrokerTec Benchmark ‒ offers yet another opportunity to invest in the on-the-run security.
Extra Levels of Cash
When the Treasury issues debt or received tax payments, it deposits its cash with the Federal Reserve Bank of New York into its Treasury General Account (TGA). As the Treasury spends its cash, that money enters the economy where it will eventually increase the level of deposits at banks. These extra levels of cash in the economy can depress the level of short-term interest rates for repo and SOFR yields. In order to avoid this, the Federal Reserve actively manages the level of cash and short-end yields by draining money thorough its reverse repo program. The Fed lends securities out of its Securities Open Market Account (SOMA) for a short period of time, and in return, receives cash.Over the prior months, we have seen a marked reduction of cash out of the TGA and into the reverse repo program. The TGA was at $1.8 trillion and as of August 26 was reported to be at $239 billion ‒ lower than pre-pandemic levels. This demonstrates the extraordinary measures the Treasury is taking to stay under the debt ceiling.
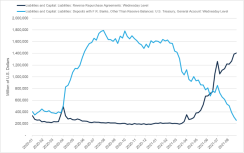
Source: Board of Governors of the Federal Reserve System (US), retrieved from FRED, Federal Reserve Bank of St. Louis, August 30, 2021.
Coupon Issuance Reduction and Tapering
The CME TreasuryWatch Tool provides a comprehensive overview of the important fiscal and economic drivers in the U.S. economy. The many trackable items include the enormous amount of Treasury coupon issuances that occurred over the past 18 months.However, the amount of coupon issuance could decrease as soon as November 2021, according to an August 3 recommendation to the Secretary of the Treasury from the Treasury Borrowing Advisory Committee (TBAC). Among the key findings were, “maintaining the current coupon auction sizes would result in a T-bill share that would fall to near zero by 2026, highlighting the degree of overfunding under current auction sizes.” The targeted range of T-bill issuance is between 15% – 20%. In order to avoid such a situation, TBAC recommended that starting in November the Treasury reduce coupon levels by $18 billion per quarter across the following coupons:
“reductions of 2-, 3-, and 5-year securities by $2 billion per month. The Committee also recommends reductions of the 10-year security by $3 billion, and the 30-year security by $2 billion for both new issues and reopenings in the quarter. For 7-year and 20-year securities, the Committee recommends declines of $3 billion and $4 billion”
Simple supply and demand suggest that fewer coupon issuance could lower rates as similar demand for these securities meets a lower supply of coupons issued.
Potentially offsetting a reduced number of coupons could be a tapering of the $120 billion of monthly ($1.4 trillion per year) Treasury ($80 billion) and mortgage-backed security ($40 billion) purchases that the Federal Bank of New York conducts.
A low tapering estimate could reduce purchases by $6 billion per month and keep it there for the foreseeable future ‒ offsetting the reduced coupon issuances noted above. A more aggressive plan would taper $5 billion per month. An even more aggressive path of tapering could reduce purchases by $10 billion per month and cease purchases after a year. Even in this aggressive scenario, the SOMA account would still increase by $700 billion. An ultra-aggressive scenario includes tapering by $15 billion per month ‒ ending purchases within eight months while removing $420 billion in assets.
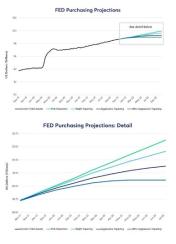
Source: Federal Reserve, Projections by CME Group Research and Product Development
As the fall season approaches, a number of fiscal and monetary hot spots below the surface could begin to shift and pose heightened risks for investors. Market participants will be watching closely and effective risk management will be critical.
Read more articles like this at OpenMarkets