By Erik Norland, CME Group
AT A GLANCE
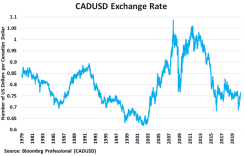
- The Canadian dollar hit a multi-year low against the U.S. dollar in March 2020
- A faster pace of reopening in Canada may have boosted Canada’s dollar vs. the U.S. dollar since March
Figure 1: CAD has fluctuated widely versus USD over the past four decades
CAD’s value versus USD is nearly impossible to explain based on traditional macroeconomic data. Both countries had a coronavirus-related spike in unemployment, which is now subsiding. Canada and the U.S. have both seen decades of low, stable inflation. Both central banks have set interest rates close to zero. The interest rate differential, measured from CADUSD futures versus the spot currency, has averaged 6 basis points annualized for the past several months.
Figure 2: US unemployment spiked higher than Canada’s and is coming down more quickly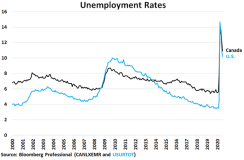

Figure 3: Canada and the US both have experienced decades of low, stable inflation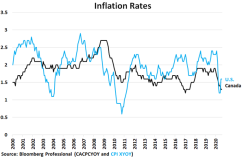
Canada Wades Into QE
One difference between the U.S. and Canada is that while the U.S. Federal Reserve engaged in three rounds of quantitative easing (QE) between 2009 and 2014, the Bank of Canada (BOC) refrained from asset purchases until after the pandemic struck. It recently joined the QE club, and with gusto.
Despite Bank of Canada’s first-ever foray into QE, it has a much smaller balance sheet than its peers relative to size of its economy (27.3% of Canadian GDP versus 33.5% of US GDP for the Fed, 35.5% of UK GDP for the Bank of England, 54.7% of eurozone GDP for the European Central Bank and 125.1% of Japan’s GDP for the Bank of Japan).
That said, relative to the size of its economy, the Bank of Canada engaged in a bigger QE than any other central bank since the end of March (+22.1% of GDP).
The relationship between CADUSD and QE is a curious and counterintuitive one. Expectations might have been that that between 2009 and 2014, as the Fed expanded its balance sheet while the BOC did not, the U.S. dollar should have weakened versus CAD. The opposite occurred. From 2009 to 2014, with the Fed creating dollars to buy mostly U.S. Treasuries and some AAA-rated mortgage debt, USD strengthened versus CAD.
In any case, BOC’s large post-pandemic round of QE, which narrowed the gap between the relative size of the two central bank balance sheets, doesn’t seem to have hurt CAD at all. In fact, since the BOC QE program began, CAD has recovered most of its recent loss in value versus USD.
So, if unemployment, inflation, interest rates and quantitative easing don’t explain movements in CADUSD, what does? The answer seems to boil down to two factors: commodity prices and the pandemic.
Figure 6: Canada, welcome to the QE club!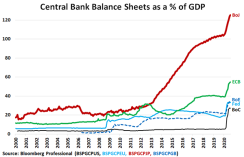
The bigger the QE, the stronger the currency? -- a counterintuitive result
Commodity prices seem to explain most of the variance in CADUSD. Specifically, an index of commodity prices weighted to reflect their importance to Canada’s economy, has tracked CADUSD extremely closely for over two decades. CAD fell with commodity prices in the first four months of 2020 but has subsequently rebounded as commodity prices came off their lows .
Figure 8: Commodity prices are the single-most important determinant of the CADUSD exchange rate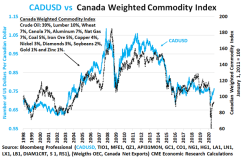
Both the U.S. and Canada have diversified economies with large service and manufacturing sectors. What differentiates the two economies, other than size, is that Canada is a large exporter of raw materials, unlike the U.S. The rise in U.S. oil production has made the country far less reliant on oil imports, but the country is still a net importer of crude oil. The U.S. is an exporter of agricultural goods, but a net importer of most industrial metals. By contrast, Canada is a net exporter of all three classes of commodities.
It could be noted that CAD has outperformed its commodity index in the past several months, rising more than expected under the circumstances. This may be the result of Canada reopening to a greater extent than the U.S. amid the pandemic. While the U.S. experienced a summer wave of infections, Canada did not.
The anecdotal evidence from restaurant activity suggests a more consistent rebound in economic activity in Canada during the summer months than in the U.S. As we have seen globally, however, the pandemic can take an unpredictable course. As such, alternative measures of economic health could give a sense of where currency markets might be heading.
Figure 9: A faster pace of reopening in Canada may also explain recent CAD strength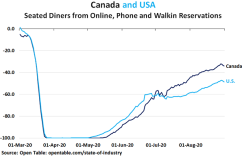
Bottom Line
- Traditional measures of economic health don’t quite explain CADUSD movements
- Canada has recently joined the global QE club
- QE appears to have a counterintuitive relationship with CADUSD
- CADUSD has moved in lockstep with commodity prices for most of the past 22 years
- A faster pace of reopening in Canada may have further boosted CAD