How should investors think about factor capacity? It’s a top-of-mind question for asset owners today, so II asked guest writer Andrew Ang, PhD, Head of Factor Investing Strategies at BlackRock for his view. Ang leads BlackRock’s Factor-Based Strategies Group.
Based on our research, there are three ways we can measure capacity, and all three suggest the As of October 31, 2019, the total U.S. factor ETF assets – factor investing done through ETFs –were at $482 billion.1 Factor investing is one of the fastest growing areas of asset management, with approximately 78% of the aggregate growth in factor assets coming from net new flows (22% from appreciation).2
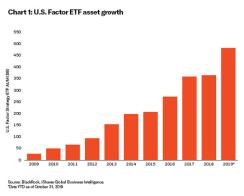
As factor ETF assets have climbed, a fair question is just how large factor strategies can become before the amount of capital begins to weigh on returns?
The answer: A LOT.
The question then turns to how investors should think about factor capacity? Based on our research there are three ways we can measure the capacity of factor-based strategies:3
Transaction costs

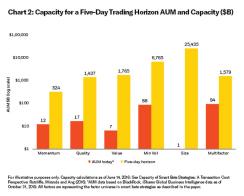
When you invest in a factor fund, you ultimately invest in a selection of stocks and will incur transaction costs. As more investors put money into the fund, transaction costs increase. At what point do the historically observed premiums in factor strategies become eroded by trading frictions?
To answer this question, we estimate factor capacity using a proprietary transaction cost model, built up from fixed costs and market impact for each individual security. Not surprisingly, the factor with the smallest capacity is momentum: the high standalone volatility and turnover of the momentum strategy leads to relatively high transaction costs – but even here, the capacity of momentum at a five-day trading horizon is $324 billion. Currently, there is only $12 billion in this strategy, which is less than 4% of capacity! Conversely, the capacity for minimum volatility is $6.8 trillion compared to only $88 billion being invested today, and the capacity for multi- factor combinations (value, quality, momentum, and low size) is in excess of $1.5 trillion!
New money vs. existing money
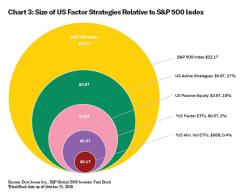
To provide some context on the size and scope of factors, let’s first review the total size of the broader investment universe.
The S&P 500 is the world’s most-tracked index. As of December 31, 2018, the total market cap of the S&P 500 was $22.1 trillion. According to S&P Dow Jones Annual Survey of Assets, active U.S. equity strategies account for $5.6 trillion of that market cap (25%), while passive market cap index strategies account for $3.6 trillion (16%). (Security holdings by other investors such as hedge funds, sovereign wealth funds, pension funds, insurance companies and other financial institutions, and individuals account for the remaining $12.9 trillion.) Comparatively, total U.S. factor strategies would account for less than 1% of this stock ownership, with minimum volatility strategies less than .004%. The scope for factors is enormous by comparison!
Traditional active mutual funds have significant factor exposures: they are underweight minimum volatility, underweight value, and tend to hold momentum stocks. Another way to measure capacity is to estimate how much money would be required for these active funds to neutralize their underweights or overweights.
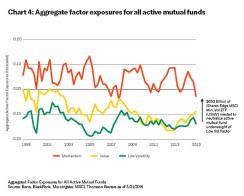
Take minimum volatility as an example. Active funds tend to be underweight minimum volatility because these funds need to take risk, relative to benchmarks, to generate returns. As such, they are underweight to low risk stocks. In order for these active funds to eliminate their underweight to minimum volatility they would need to collectively invest $650 billion in minimum volatility! (Compared to just $88 billion in total U.S. minimum volatility AUM today.)
Factor premiums and invested capital in equilibrium
A final way to quantify the capacity of factor strategies is to jointly estimate factor premiums and invested capital. For the nerds who might appreciate it, the estimates of factor capacity using transaction costs or active fund holdings are partial equilibrium calculations. But in equilibrium, prices and quantities are determined together.
Just like a seesaw, large flows into a set of securities will push their prices upward, and their future expected returns decrease. Similarly, large flows out of subset of stocks will send prices falling, and push up risk premiums. With an appropriate economic model, we can estimate the extreme shifts in capital from one strategy to another required to eliminate the historically observed factor premiums.
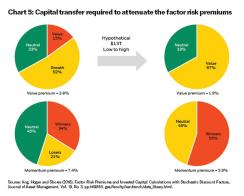
We estimate factor premiums when all the capital from the lowest 30% of expensive stocks (growth) is moved to the top 30% of the cheapest stocks (value). That is, we buy the factor with the high return (value) and sell the stocks on the other side. This is a hypothetical flow of $13 trillion. This flow would reduce the value premium by approximately half (from 3.8% to 1.9% per year), but importantly the value premium still exists.
There are some factors where even with these extreme movements in capital, the factor premiums barely move. For example, doing this same exercise for the minimum volatility premium, we find the premium drops slightly from 6.1% to 5.4% per year. Modeling the same exercise for momentum strategies, the momentum premium shrinks from 7.4% to 5.9%.
Factor capacity is enormous
The large capacity of factor strategies – estimated from transaction costs, examining factor loadings of active funds, and using economic models to link returns and capital invested – reflects the enduring nature of their economic underpinnings. It’s the economic rationales of a reward for bearing risk, structural impediments, or investors’ behavioral biases that explain why the long-run capacity of factors is large, and why factors will continue to be broad and persistent drivers of returns for a long time to come.
But large long-term factor capacity doesn’t mean that factors don’t vary over time – and tilting factors around strategic allocations can be, for certain investors, a way to generate additional incremental returns.
1 BlackRock, iShares Global Business Intelligence. Data as of October 31, 2019.
2 MorningStar, A Global Guide to Strategic Beta Exchange Traded Products March 2019.
3 Ratcliffe, R., Paolo Miranda and Andrew Ang. “Capacity of Smart Beta Strategies: A Transaction Cost Perspective.” The Journal of Index Investing Winter 2017, 8 (3) 39-50 Ang, A., Ked Hogan and Sara Shores. “Factor Risk Premiums and Invested Capital: Calculations with Stochastic Discount Factors.” Journal of Asset Management, Vol. 19, No. 3, pp.145-155. Data from July 1963 to December 2015 Ang, A., Ananth Madhavan and Aleksander Sobczyk. “Crowding, Capacity, and Valuation of Minimum Volatility Strategies.” The Journal of Index Investing Spring 2017, 7 (4) 41-50.
© 2019 BlackRock, Inc. All rights reserved.
Carefully consider the Funds' investment objectives, risk factors, and charges and expenses before investing. This and other information can be found in the Funds' prospectuses or, if available, the summary prospectuses which may be obtained visiting the iShares ETF and BlackRock Mutual Fund prospectus pages. Read the prospectus carefully before investing.
Investing involves risk, including possible loss of principal.
The iShares Minimum Volatility Funds may experience more than minimum volatility as there is no guarantee that the underlying index's strategy of seeking to lower volatility will be successful.
There can be no assurance that performance will be enhanced or risk will be reduced for funds that seek to provide exposure to certain quantitative investment characteristics ("factors"). Exposure to such investment factors may detract from performance in some market environments, perhaps for extended periods. In such circumstances, a fund may seek to maintain exposure to the targeted investment factors and not adjust to target different factors, which could result in losses.
Asset allocation and diversification may not protect against market risk, loss of principal or volatility of returns.
The strategies discussed are strictly for illustrative and educational purposes and are not a recommendation, offer or solicitation to buy or sell any securities or to adopt any investment strategy. There is no guarantee that any strategies discussed will be effective.
The information presented does not take into consideration commissions, tax implications, or other transactions costs, which may significantly affect the economic consequences of a given strategy or investment decision.
This material represents an assessment of the market environment as of the date indicated; is subject to change; and is not intended to be a forecast of future events or a guarantee of future results. This information should not be relied upon by the reader as research or investment advice regarding the funds or any issuer or security in particular.
This document contains general information only and does not take into account an individual's financial circumstances. This information should not be relied upon as a primary basis for an investment decision. Rather, an assessment should be made as to whether the information is appropriate in individual circumstances and consideration should be given to talking to a financial advisor before making an investment decision.
© 2019 BlackRock, Inc. All rights reserved. BLACKROCK, BLACKROCK SOLUTIONS, BUILD ON BLACKROCK, ALADDIN, iSHARES, iBONDS, iRETIRE, LIFEPATH, SO WHAT DO I DO WITH MY MONEY, INVESTING FOR A NEW WORLD, BUILT FOR THESE TIMES, TARGET DATE EXPLORER the iShares Core Graphic, CoRI and the CoRI logo are registered and unregistered trademarks of BlackRock, Inc., or its subsidiaries in the United States and elsewhere. All other marks are the property of their respective owners.
ICRMH1219U-1035629