
Investors can be forgiven if they see cause for concern in return forecasts these days, and if they feel less than confident about meeting their objectives. That anxiety can be fed by an expected increase in volatility – and it can be argued we’ve already reached a significant inflection point in that regard – that leaves investors facing the prospect of de-risking their portfolios using rather dated approaches.
“There are a lot of things pushing volatility,” says the CIO of a U.S. state teacher retirement fund. “We have great fundamentals, but things are starting to shake a little bit, and we are more concerned about it than we’d like to be – and we think that volatility is likely to go up. We built volatility into our strategy at a normal or mean level, and right now we’re on the higher end of normal.”
The State of Play
When investors look to the horizon today and anticipate increased uncertainty, they see numerous sources of major risk, including:
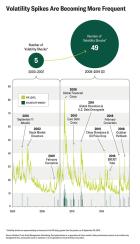
- More frequent volatility spikes: In the eight years prior to the 2008-2009 global financial crisis, a one day move of five points or more on the VIX occurred only five times. Post-crisis, such a spike has occurred 48 times – with “spike” being the key word as it relates to return distribution.
- An inconsistent business cycle: The U.S. business cycle has been seesawing between expansion and slowdown, and for the first time since the crisis, the leading economic indicators are flashing yellow, according to the Leading Economic Index.
- International trade conflict: Global trade tensions, and their knock-on effects of global supply chain recalibration and redistribution, have rocked global growth numbers. The U.S.-China dispute will likely take years to resolve. The “one world, two systems” model – capitalism on one side, statism on the other – will be detrimental to growth and additive to volatility.
- Uncertain central bank policies: Technology has a massive deflationary effect, which consumers love but central banks not so much because it eliminates their monetary policy target. Most central banks target inflation. If they can’t stimulate inflation to the appropriate level, how do they remain relevant? What is that new policy model behind their actions? “There currently exists no macroeconomic theory that is consistent with today’s data,” says Michael Hunstad, Ph.D., Head of Quantitative Strategies at Northern Trust Asset Management. “If we don’t know what to do from a monetary policy perspective, it has implications for volatility.”
- More volatility selling: The microstructure of the market has changed materially, and thanks to algorithmic trading, volatility selling has become more popular since the global financial crisis, and that has contributed to more downside volatility, with much more likely to come.
The 3 Major Sources of Volatility on the Horizon
For institutional investors, it’s an interesting prospect to consider – a plan, endowment, or foundation needs its money when it needs it, regardless of what the markets can provide in a given moment or trend period.
“If the equity return expectation is only 5.8%, this contractionary environment may indeed be conducive to a different approach within an investor’s equity bucket,” says Michael Hunstad, Ph.D., Head of Quantitative Strategies at Northern Trust Asset Management.
Although the equity sleeves of most investors today contain a significant amount of passive investments, asset allocators seem most likely to look for a fresh approach – and alpha – by teaming with active managers.
“Passive is good in the beginning of a cycle, but as valuations are stretched, it’s time for more active management,” says the CIO of a U.S. state teachers’ retirement fund.
“We’re not trying to time the cycle,” says the Head of Equities at a European pension fund. “Equity valuations are high, there’s more volatility creeping in. The best part of the equity run is over. There’s more volatility and not the return we’ve seen over the past few years.”
This investor says his portfolio is “roughly a third active and two-thirds passive,” and that the active portion is focused on active quantitative strategies and impact investments. “It’s a combination of active and quant strategies. The active quant is a fixed allocation, and we believe a factor portfolio can help to reduce volatility and generate returns. So, we expect our managers to be able to build equity portfolios based on factors.”
A “Different” Approach
The “different” approach Hunstad mentions is based on simultaneously strengthening and de-risking a core equity portfolio so investors gain exposure to compensated risks within the equity market, and, through the use of style factors, understanding the excess return potential in different economic environments.
For example, says Hunstad, “We have just come through a slowdown. In a slowdown, low-volatility stocks tend to do reasonably well, along with high momentum and higher quality stocks. We saw this pattern play out over the last several months and years. In contrast, size, value, and high-dividend yield tended to be relatively lackluster, even having negative performance. In a contractionary environment, however, low volatility exhibits dominant alpha above the cap-weighted benchmark.”
Hunstad and his team believe that opportunities to outperform exist if you know where to find them, and that such opportunities aren’t contingent on a traditional “risk-off” execution. That said, active strategies in general vary widely, and how they are utilized by investors is very relevant to the holistic performance an investor might achieve.
“Over the years, we’ve analyzed many equity allocations from our clients, and while they have evolved, use of the so-called style box is still prominent,” says Jordan Dekhayser, Head of Quantitative Equity Research and Strategy, Northern Trust Asset Management. “While it’s certainly true that individual managers can and do add value, investors need to closely consider their overall portfolio in aggregate. Certain portfolio constructions can prevent the opportunity to provide enough active risk – or, in other words, enough potential to outperform the market – than an investor would need to close a 2-3% anticipated return gap. Even if you have individual managers that have a lot of active risk, when you put them all together they tend to plot very close to the benchmark, and holistically there’s not a lot of active risk.”
If diversification of managers doesn’t necessarily lead to true diversification in portfolios, overdiversification of managers is a risk in itself when active management fees eat into alpha. Faced with a choice of a mix of passive (beta), fundamental active, and factors strategies, many investors are aware of data that shows fundamental active management hasn’t necessarily provided the jolt to returns for which they’ve hoped.
- De-Risking 1.0 reallocates more to bonds, less to stocks, and in general lower-risk asset classes.
- De-Risking 1.1 replaces the existing equity allocation with core low volatility exposure.
- De-Risking 2.0 increases the allocation to low-volatility while staying risk neutral to De-Risking 1.0.
Focusing on De-Risking 1.0 and De-Risking 2.0, assume that the investor is comfortable with a realized risk of 6.75%. What might the investor get for a similar risk budget in De-Risking 2.0, using low-volatility equities as the equity allocation at the core versus a cap-weighted MSCI World allocation? Significant improvement. The risk remains the same, the return increases by about 1.5%, to 7.67% from 6.17%. The Sharpe ratio improves by 0.22, and the maximum drawdown stays about the same. But the investor achieved all this with a greater allocation to equities than is present in De-Risking 1.0. Not a bad outcome when the max drawdown is the same.
“If we put our assumptions about forward returns into De-Risking 1.0, we’re looking at similar performance to what we’ve seen since 1999 using De-Risking 1.0, or perhaps even lesser performance given where yields are at today,” says Michael Hunstad, Ph.D., Head of Quantitative Strategies at Northern Trust Asset Management.
“That’s the classic knee-jerk reaction to de-risking,” he continues, referencing the move to include more bonds. “But it’s not uncommon. Investors are very cautious about that given where Treasury and bond yields are in the U.S. and globally.”
Is there potential for investors to realize even greater excess return in a de-risked portfolio that mitigates for the possibility of a down market? There just might be. Think of it as De-Risking 2.1, and it adds quality factors to low-volatility factors.
Comparing two de-risking portfolios – one low-volatility only, the other a combination of low-volatility and quality factors – it’s apparent adding quality to a low-volatility portfolio helps to the tune of a 2% improvement in the top decile, and some improvement in the second decile.
“Volatility measurement is almost exclusively price-based,” adds Hunstad. “By adding a quality dimension, you have more of a view of the financial picture of a company, in addition to that price-based factor. When you meld those ideas – low price volatility, good profitability, cash flow, balance sheet, and so on – that tends to be your best bet.”
And, quite possibly, a major step toward closing the anticipated return gap investors are projected to face over the next five years.
Disclosures
Important Information
The information contained herein is intended for use with current or prospective clients of Northern Trust Investments, Inc. The information is not intended for distribution or use by any person in any jurisdiction where such distribution would be contrary to local law or regulation. Northern Trust and its affiliates may have positions in and may effect transactions in the markets, contracts and related investments different than described in this information. This information is obtained from sources believed to be reliable, and its accuracy and completeness are not guaranteed. Information does not constitute a recommendation of any investment strategy, is not intended as investment advice and does not take into account all the circumstances of each investor. Opinions and forecasts discussed are those of the author, do not necessarily reflect the views of Northern Trust and are subject to change without notice.
This report is provided for informational purposes only and is not intended to be, and should not be construed as, an offer, solicitation or recommendation with respect to any transaction and should not be treated as legal advice, investment advice or tax advice. Recipients should not rely upon this information as a substitute for obtaining specific legal or tax advice from their own professional legal or tax advisors. References to specific securities and their issuers are for illustrative purposes only and are not intended and should not be interpreted as recommendations to purchase or sell such securities. Indices and trademarks are the property of their respective owners. Information is subject to change based on market or other conditions.
All securities investing and trading activities risk the loss of capital. Each portfolio is subject to substantial risks including market risks, strategy risks, adviser risk and risks with respect to its investment in other structures. There can be no assurance that any portfolio investment objectives will be achieved, or that any investment will achieve profits or avoid incurring substantial losses. No investment strategy or risk management technique can guarantee returns or eliminate risk in any market environment. Risk controls and models do not promise any level of performance or guarantee against loss of principal. Any discussion of risk management is intended to describe Northern Trust’s efforts to monitor and manage risk but does not imply low risk.
Past performance is no guarantee of future results. Performance returns and the principal value of an investment will fluctuate. Performance returns contained herein are subject to revision by Northern Trust. Comparative indices shown are provided as an indication of the performance of a particular segment of the capital markets and/or alternative strategies in general. Index performance returns do not reflect any management fees, transaction costs or expenses. It is not possible to invest directly in any index. Net performance returns are reduced by investment management fees and other expenses relating to the management of the account. Gross performance returns contained herein include reinvestment of dividends and other earnings, transaction costs, and all fees and expenses other than investment management fees, unless indicated otherwise. For additional information on fees, please refer to Part 2a of the Form ADV or consult a Northern Trust representative.
Forward-looking statements and assumptions are Northern Trust’s current estimates or expectations of future events or future results based upon proprietary research and should not be construed as an estimate or promise of results that a portfolio may achieve. Actual results could differ materially from the results indicated by this information.
If presented, hypothetical portfolio information provided does not represent results of an actual investment portfolio but reflects representative historical performance of the strategies, funds or accounts listed herein, which were selected with the benefit of hindsight. Hypothetical performance results do not reflect actual trading. No representation is being made that any portfolio will achieve a performance record similar to that shown. A hypothetical investment does not necessarily take into account the fees, risks, economic or market factors/conditions an investor might experience in actual trading. Hypothetical results may have under- or over- compensation for the impact, if any, of certain market factors such as lack of liquidity, economic or market factors/conditions. The investment returns of other clients may differ materially from the portfolio portrayed. There are numerous other factors related to the markets in general or to the implementation of any specific program that cannot be fully accounted for in the preparation of hypothetical performance results. The information is confidential and may not be duplicated in any form or disseminated without the prior consent of Northern Trust.
© 2019 Northern Trust Corporation. Head Office: 50 South La Salle Street, Chicago, Illinois 60603 U.S.A. Incorporated with limited liability in the U.S. Products and services provided by subsidiaries of Northern Trust Corporation may vary in different markets and are offered in accordance with local regulation. This material is directed to professional clients only and is not intended for retail clients. For Asia-Pacific markets, it is directed to expert, institutional, professional and wholesale investors only and should not be relied upon by retail clients or investors. For legal and regulatory information about our offices and legal entities, visitnortherntrust.com/disclosures.
Northern Trust Asset Management is composed of Northern Trust Investments, Inc. Northern Trust Global Investments Limited, Northern Trust Fund Managers (Ireland) Limited, Northern Trust Global Investments Japan, K.K, NT Global Advisors Inc., 50 South Capital Advisors, LLC and investment personnel of The Northern Trust Company of Hong Kong Limited, and The Northern Trust Company.
Views vary, of course, but most CIOs are focused to some degree on de-risking. According to the CIO of a U.S. state retirement fund, his team tries to “estimate fair value of all assets on an ongoing basis, and observe whether prices at any moment are below or ahead of that value. Right now, we feel the equity markets are about 25% overvalued, and that’s just enough perceived overvaluation to trip our thresholds for us to go to our minimum risk exposure, and we are making progress toward that.”
Traditionally, the easy way to de-risk is to move from higher risk asset classes to lower risk asset classes. In 2009, about 35% of institutional investors’ portfolios consisted of public equities, a percentage that has dropped to around 20% today, according to Greenwich Associates’ study “Asset Allocation Trends in Institutional Asset Management, 2018 U.S. Institutional Investors Research.”
Clearly, de-risking in and of itself is not the challenge – the main hurdle is how do investors de-risk without sacrificing returns in an iffy return environment. According to one recent survey of U.S. state and local pension funds, the average rate of return assumptions across 129 plans is 7.3%. However, a review of Northern Trust Asset Management’s Capital Market Assumptions asset class return forecasts shows that no single asset class, with the exception of private equity, has an expected return above 6.5%, and a vanilla 60/40 portfolio only expects to produce around 4.7%, leaving a 2-3% shortfall for the return assumptions among that cohort of pension plans.
Quick Q&A with Michael Hunstad, Ph.D., Head of Quantitative Strategies at Northern Trust Asset Management
II: Can investors determine if they’re prepared for risk going forward?
Investors became somewhat ambivalent about risk during the long period of low risk, low volatility, and high returns – it almost didn’t matter how much risk you were taking. Going forward, that is all changing. So, the first step to determining if you’re ready for what’s coming is to determine the source of risk in your portfolio. Is it asset allocation, or within the asset class itself? The most important consideration today is the risk within the asset class. If you are dominantly exposed to risk you aren’t compensated to take, you aren’t really prepared for what’s ahead.
II: Are we at a market inflection point?
From the real side of the economy, no. Our view is that over the next five years we will not be entering a recession. But, keep in mind that even if the real side remains relatively stable, the volatility of the markets doesn’t necessarily behave the same way. Are we at a volatility inflection point? Absolutely. We’ve already passed that inflection point. The future will be very different from the past, so that inflection point is critical in thinking about how you’ll prepare portfolios for solid but muted growth going forward, accompanied by a lot more volatility.
II: How is the future going to look different from the past?
We’ve seen a rise in realized volatility and more dispersion in sectors and country returns, for example. There are a lot more elements of risk operating under the hood. This creates issues, especially for actively managed strategies within the fixed income or equity space. For example, so far in 2019, the markets have had a little higher volatility, but there has been tremendous sector rotation. January and February were completely risk on, and we saw the cyclical sectors outperform the defensive sectors by as much as 900 basis points. In March, that all shifted around – it was a mirror image, with the defensives outperforming the cyclicals by about the same amount. All of this, while on the surface the markets seemed relatively calm. In a similar scenario going forward, if you aren’t cognizant of that sector rotation, you could be whipsawed.
Learn how to "Strengthen Your Portfolio Core."
For investors who find themselves facing increased volatility and a need to address potential downside risk in an equities market that drives a large part of their portfolio performance, there is some good news.
“Volatility in and of itself impacts the portfolio, but in general, it’s also good for factor performance,” says Michael Hunstad. “Most factors1 do quite well in an above median VIX-environment, when volatility levels are relatively high. Low volatility is very asymmetric in that regard. Growth and momentum factors have done well over the last 10 years being largely below median in terms of volatility. In a higher risk environment – in other words, in the anticipated higher volatility world – quality factors do well, as you might expect, but don’t count out value, size, and dividend yield.”
That insight is part of why there is, in fact, another way for investors to lower volatility and continue to grow their assets, without the potential downside of lowering portfolio return expectations, without the higher fees of alternatives strategies, and without lowering liquidity.
Recognizing the imperative to effectively address investors’ de-risking needs, Northern Trust Asset Management developed its Quality Low-Volatility (QLV) strategy, which is designed to reduce absolute volatility and outperform relative to the market capitalization-weighted benchmark. QLV can be considered as a core equity allocation which seeks to deliver strong market upside potential while reducing downside risk. QLV also uses the quality factor to further reduce volatility and potentially add incremental returns.
Learn more about Northern Trust Asset Management’s approach to quantitative low-volatility strategies.
1 Factors Defined Quality: The Quality factor targets companies with efficient management, profitability, and strong cash flows. Value: The Value factor targets companies that trade at low current valuations. Low Volatility: The Low-Volatility factor targets companies with less volatile cash flows. Dividend Yield: The Dividend Yield factor targets companies that pay large dividends. Momentum: The Momentum factor targets companies that have strong market sentiment and analyst sentiment. Size: The Size factor targets companies of smaller market capitalization.
From a historical perspective, it has been demonstrated that style factors deliver superior risk-adjusted returns compared to passive market cap-weighted indexes, and that they offer more persistent performance compared to traditional active management. As such, style factors are a compelling option for investors looking to de-risk their portfolios – which can be a bit of a surprise for some investors who think of de-risking as a defensive posture.
But that view isn’t common among all investors.
“About 25% of our equity allocation is in factors,” says the portfolio manager for public equities at a U.S. state retirement system. “The reason why we split it 75-25 initially is because our analysis showed that it improves the Sharpe ratio. We started off with a quarter of the equity allocation, and we wanted to see how it does over time because it’s a long-term strategy where after three to five years we should be able to harvest some risk premia. If that’s the case we may increase it, maybe up to 50%. It depends on what our findings are. We’ll do another assessment at that time. The point was to dip our toe into it and see if we should increase or reduce it over time. During implementation the main challenge was a lot of churn when we traded for the quarterly rebalance.”
What’s behind style factor return premia? Explanations and interpretations vary, but tend to fall into one of three categories:
- Risk-based explanations imply that volatility alone is not enough to describe risk, and measures such as the Sharpe ratio do not truly represent risk-adjusted performance – i.e. style factor investors earn a premium because they are actually bearing more risk.
- Structural explanations assert there are constraints that prevent CAPM assumptions from holding. The most common of these explanations is that if investors are unable to use leverage, but have high return requirements, they have tended to focus on high beta assets to create internal leverage. This creates inefficiencies as high beta assets become mispriced relative to the market.
- Behavioral explanations suggest that investors are prone to persistent behavioral biases that ultimately manifest as factor anomalies such as representative bias and asymmetric risk preferences.
Learn why the quest to capture efficient alpha requires a challenge to modern portfolio theory.
Advanced portfolio design and implementation
Style factors are susceptible to cyclicality and expose investors to the risk of sustained underperformance – but style factor cyclicality can be mitigated by employing multi-dimensional factor definitions and diversifying across factors on top of other methods of reducing risk without sacrificing returns.
The key to the mitigation of cyclicality in the use of style factors is intelligent design and implementation, which accommodate less severe drawdowns, which in turn may encourage investors to stay the course during the ebbs and flows of volatility.
The chart below helps illustrate how a factor approach might help solve the dual challenges of de-risking while meeting return expectations.
Using a simple 60/40 portfolio and starting with a passive allocation beginning in 1999, notice that the portfolio has returned 5.5% at a 9% realized risk. That performance can safely be called underwhelming for the relevant time horizon – and it suffered a nearly 35% drawdown during the financial crisis in 2008. This is a time period where stocks and bonds have similar realized returns and, stocks had significantly higher realized volatility. (For the purposes of this example, a 60/40 blended benchmark refers to the Asset Allocation Blend Index, consisting of 60% MSCI All Country World Index and 40% Bloomberg Barclays U.S. Aggregate Bond Index. It is not possible to invest directly in an index.)
Now, look at an allocation that uses a low-volatility factor for its equity allocation rather than the market cap-weighted index. It has lower risk than the benchmark, making it a potentially ideal candidate for investors looking to de-risk, provided it improves risk-adjusted returns from a risk reduction standpoint and from an improvement in the numerator.
The current and anticipated return environment as described earlier in the report is one that has been very conducive to low-volatility factor performance. The scenario above shows unambiguous improvement on several important measures to investors – a return improvement of 134 basis points, from 5.52 to 6.86%; a realized reduction in risk of 2.56% – a 28% reduction, from 9.07% all the way down to 6.51%; a nearly doubling of the Sharpe ratio from 0.42 to 0.79, and, importantly, that is counting the numerator and the denominator.
Finally, during the steep market equity market drawdowns in 2008 a market cap-weighted index, by definition, experienced 100% of that drawdown. In the traditional 60/40 context that led to a nearly 35% drawdown. A hypothetical low-volatility factors portfolio in that same scenario improved the drawdown by a little over 11%.
“If you look at the full body of research available, regardless of asset class or geography, and across all aspects of the market capitalization spectrum, it points to the resounding conclusion that lower volatility securities, in general, tend to come with higher returns – especially in markets that are punctuated by volatility spikes,” Michael Hunstad, Ph.D., Head of Quantitative Strategies at Northern Trust Asset Management.