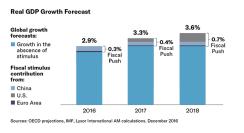
Before he even took the oath of office, U.S President Donald Trump seemed to have pulled off the trick of kickstarting global fiscal expansion. Several governments have committed to major investments meant to grow their economies and expand or repair their infrastructure. The U.K. has presented its biggest government investment programme for over a decade. China has announced a $503 billion rail expansion plan, as well as a colossal infrastructure spending plan designed to support growth and drastically improve connectivity to most of its major cities. Germany has embarked on its first major government spending boost since the financial crisis. Other eurozone governments could follow suit as ECB support starts to wane later this year.
Playing the push
Massive fiscal spending could send the global economy back to the future. All the quantitative easing of recent years has kept the bond bears at bay, but supersized and synchronized fiscal expansion favors equities, despite the political and policy uncertainty ahead.
Markets have already moved sharply, and performed very differently, since Trump’s victory, leading us to a simple question: What’s the best way to play the push?
U.S. equities have risen furthest and fastest since that fateful day in November. Trump’s fiscal push could extend the ageing expansionary cycle to the end of 2018 or early 2019. Stronger growth, tax cuts and overseas cash repatriation all have a part to play. Just how much upside is left for broader indices is unclear. Other areas may have more room to grow, provided campaign promises are kept. Expect a bumpy ride if they are not.
Push strategies at a glance

North American Equities
- Diversify or concentrate? The S&P 500 offers broad market-weighted exposures, while the Dow Jones Industrial Average is a much narrower, price-weighted index.
- If you believe the push will lift small-caps, generally a more domestic-oriented area, then consider the Russell 2000.
- Should Trump slash regulation as promised, you may want to consider the Russell 1000 Value or Russell 2000 indices, given their more substantial exposures.
- The NASDAQ 100 index remains a key way to play the information technology theme.
- Canada’s TSX index may benefit from its neighbor’s economic acceleration, especially given its high weightings towards Financials and Energy.
- European equities could be this year’s headliners, despite the potential for political upheaval. ECB support is assured, fiscal expansion possible and higher inflation likely by year end. If the politics play on your mind, reduce risk with minimum variance indices.
- Pure factors like low size and value factors play very firmly to recovery. Should you be slightly cagier, consider the MSCI EMU Small Cap and MSCI EMU Value indices.
- Diversify or concentrate? The MSCI Europe offers a more balanced representation of Europe, but should you favour the core, the Euro Stoxx 50 index has a 70% exposure to Germany and France.
- Should Brexit turn into a damaging battle for U.K. equities, the Euro Stoxx 50 has far less exposure to the U.K. than the MSCI Europe.
- Should you favour single country stories, consider CAC 40, DAX, IBEX and MIB indices.
- EM and Asian markets have so far priced the problems with Trump’s policy agenda, rather than its potential benefits. Those fears are quite possibly overblown, and if so opportunities could arise. Look to broad indices, or more specific single country exposures.
- The MSCI Pacific ex-Japan has a 60% weighting towards Australia and contains no EM stocks. The MSCI AC Asia ex-Japan has a much stronger EM bias, with significant tilts towards China, South Korea, Hong Kong and Taiwan.
- The MSCI Pacific ex-Japan has a 40% weighting towards Financials.
- For Information Technology however, the MSCI AC Asia ex-Japan and MSCI AC Asia Pacific ex-Japan are better suited.
- Diversify or concentrate? The MSCI AC Asia ex-Japan and MSCI AC Asia Pacific ex-Japan indices contain four times as many stocks as their Pacific counterpart.
As the push gathers momentum, you need flexibility, reach and the ability to move quickly in and out of positions to seize the opportunities. That’s where ETFs come in, and in particular, Lyxor, the longest-standing European provider of U.S. equity ETFs. We offer 15 ways to explore North American markets, including the most efficient S&P 500 ETF for the last four years.
In Europe, we provide more than 40 ways to engage with the markets, including the world’s largest ETFs on several core European indices, like the MSCI Europe, CAC40, FTSE 100, IBEX 35 and FTSE MIB1. True to our commitment to performance, we provided the most efficient ETFs for six out of 10 core index exposures in 20161. Further afield, we have more than 11 years of experience managing Asian equity ETFs, and now count the largest China, Japan and India ETFs in the market among our 15-strong range.
For a holistic view of Lyxor’s global insights on equities and how to best prepare your portfolio to leverage the fiscal push, download the strategic documents that accompany this story. Or you can visit our website at www.lyxoretf.com.
Related Content
Preparing your portfolio for the Fiscal Push
Playing the push ETFs and fiscal expansion
1Lyxor International Asset Management. Data according to the efficiency indicator created by the Lyxor 's research department in 2013 and examining the three components of performance : tracking error, liquidity and spread purchase / sale.
***********************************************************
This communication is for professional clients only.
This document is for the exclusive use of investors acting on their own account and categorised either as “Eligible Counterparties” or “Professional Clients” within the meaning of Markets In Financial Instruments Directive 2004/39/EC.
This document is of a commercial nature and not of a regulatory nature. This document does not constitute an offer, or an invitation to make an offer, from Société Générale, Lyxor International Asset Management or any of their respective affiliates or subsidiaries to purchase or sell the product referred to herein.
We recommend to investors who wish to obtain further information on their tax status that they seek assistance from their tax advisor. The attention of the investor is drawn to the fact that the net asset value stated in this document (as the case may be) cannot be used as a basis for subscriptions and/or redemptions. The market information displayed in this document is based on data at a given moment and may change from time to time. The figures relating to past performances refer or relate to past periods and are not a reliable indicator of future results. This also applies to historical market data. The potential return may be reduced by the effect of commissions, fees, taxes or other charges borne by the investor.
Lyxor International Asset Management (Lyxor ETF), société par actions simplifiée having its registered office at Tours Société Générale, 17 cours Valmy, 92800 Puteaux (France), 418 862 215 RCS Nanterre, is authorized and regulated by the Autorité des Marchés Financiers (AMF) under the UCITS Directive and the AIFM Directive (2011/31/EU). Lyxor ETF is represented in the UK by Lyxor Asset Management UK LLP, which is authorised and regulated by the Financial Conduct Authority in the UK under Registration Number 435658.