Like many other fixed-income assets, emerging markets external (sovereign) debt has rallied sharply in recent weeks. While EMD has not moved as dramatically as high yield in the wake of the Federal Reserve’s QE3 announcement, its spread has continued a narrowing trend that began in early June. Since the end of May, the EMBI Global Diversified spread has fallen 135bp. With U.S. Treasuries not moving much, the all-in yield in the EMBIG-Div, which dropped below 5 percent in mid-July, now stands just above 4.5 percent. At first glance, this yield, meager by long-run EMD standards, may not seem very appealing.
Two factors, though, make EMD still worth considering. First, while slight compared with their long-run average, spreads remain reasonable next to their more recent history, in this case the more relevant benchmark. Second, while yields have shrunk across the fixed-income universe, implied volatility in the U.S. Treasury market has also faded. To the extent that this low-volatility environment persists, Sharpe ratios in various credit markets may remain interesting even with prosaic headline yields.
Since the start of 1994, the EMBIG spread has averaged about 570bp over Treasuries. EM creditworthiness has improved significantly over the long run. The average credit rating of the EMBIG has risen almost continuously since the early 2000s, and much of the index now stands in investment-grade territory. The warranted credit spread, then, has likely narrowed over time, rendering long-run spread comparisons misleading. In this respect, EMD differs from, say, high yield, where credit quality is by definition constrained, and where spread levels can safely be checked against the entire history of the market. EMD spreads during 2005-07 and 2010-present (taking out the crisis period, when spreads blew out) have averaged 280bp. In that sense, today’s spread level seems broadly fair, even assuming no further improvement in creditworthiness. EM credit ratings, though, likely will continue to improve, given the faster trend pace of growth in EM economies than in the developed world and taking into account the positive correlation between per-capita GDP and perceived creditworthiness.
EMBIG Diversified yield to maturity and spread over U.S. Treasuries (%)
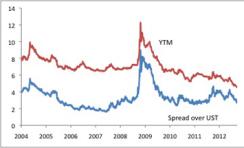
Chart 1
Source: JPMSI; data through September 20, 2012 |
EMBIG average credit rating

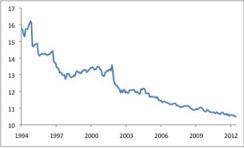
Chart 2
Source: JPMSI, JPMAM; data as of July 2012; ratings expressed on arithmetic scale with lower numbers implying higher ratings |
MOVE (U.S. Treasury implied volatility)
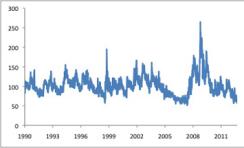
Chart 3
Source: Bloomberg; data through September 20, 2012 |
If this low-volatility environment continues, EMD yields that appear modest by medium-term standards become more interesting. In a low-vol world, a 4.5% yield with minimal defaults and improving credit trends may produce an attractive Sharpe ratio. Investors who accept the premise that low-vol may be here to stay, at least for a while, may need to consider modifying their thinking about yield levels in that looks increasingly like a coupon-clipping world.