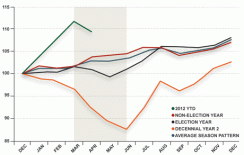
If Presidential election cycles furnish a market precedent, then spring showers may bring summer flowers. Subpar market performance in recent weeks compared to past presidential election cycles and average seasonal trends bolster the case for a summer stock market rally, according to technical research analysts at Merrill Lynch. Historically, April and May are the cruelest months for investors — in years when the White House is at stake.
“This pattern supports our market view and suggests buying a late spring to early summer dip,” say analysts at Merrill. They predict a sluggish market through May then a rally starting in June that will heat up in July and August. For an added measure of confidence, a summer rally would track typical performance in the second year of ten-year cycles that start in years ending with a zero, the so-called decennial pattern.
The bottom line for investors swayed by this technical analysis? Make hay before the sun shines.
| S&P 500 average monthly price returns- data from 1928 to present. | ||||||
| MONTH | PRESIDENTIAL ELECTION YEAR | NON-PRESIDENTIAL ELECTION YEAR | AVERAGE SEASONAL PATTERN | DECENNIAL YEAR 2 | ||
| Jan | 0.26% | 1.59% | 1.26% | -0.76% | ||
| Feb | 0.06% | -0.26% | -0.15% | -0.65% | ||
| Mar | 1.19% | 0.34% | 0.55% | -1.67% | ||
| Apr | -0.60% | 1.88% | 1.27% | -4.25% | ||
| May | -1.30% | 0.34% | -0.07% | -3.28% | ||
| Jun | 1.38% | 0.48% | 0.71% | -1.98% | ||
| Jul | 1.98% | 1.31% | 1.48% | 5.17% | ||
| Aug | 3.11% | -0.07% | 0.72% | 6.63% | ||
| Sep | -0.45% | -1.40% | -1.16% | -2.20% | ||
| Oct | -0.07% | 0.58% | 0.41% | 1.64% | ||
| Nov | 0.61% | 0.60% | 0.61% | 3.13% | ||
| Dec | 1.43% | 1.47% | 1.46% | 1.67% | ||
| Source: BofA Merrill Lynch Global Research; Bloomberg | ||||||
| S&P 500 average monthly price chart | ||||||

| ||||||
| Source: BofA Merrill Lynch Global Research; Bloomberg | ||||||


