While some people deem stocks expensive relative to 10-year trailing earnings, we take a forward-looking approach. It starts with the premise that the stock market is not a casino and stock prices are not pulled out of thin air: they reflect the intrinsic value of companies’ future earnings.
Let’s start with basics. Stocks represent an ownership claim on a share of company earnings. Hence, stock prices reflect (imperfectly, of course) the value of companies’ current earnings and potential earnings growth. In computing the expected returns for stocks, what matters is the starting price, earnings, dividends (the portion of earnings distributed to shareholders), earnings growth and changes in P/E. As you might expect, low starting prices, high earnings and dividends, high growth, and P/E expansion are all good for future stock returns.
The models we use when investing are complex, but a simple argument makes the point. The expected return for a Treasury bond held to maturity is equal to its yield. Similarly, the expected return for a stock equals its earnings per share (EPS) divided by its price — its earnings yield — if the company has no growth prospects and therefore returns all of its earnings to shareholders. If the company does have growth prospects, it would retain some of its earnings to fund growth. In that case, the expected return equals the dividend yield plus dividend growth. If the company pays out a constant share of earnings as dividends, dividend growth equals earnings growth.
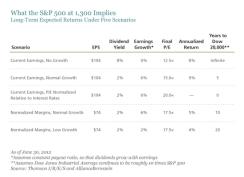
Let’s apply this framework to the S&P 500 Index’s price level of about 1,300. Consensus forecasts call for the index to have $104 in earnings per share this year. If the companies in the index didn’t expect any growth, they would pay out all their earnings as dividends, and earnings and dividends wouldn’t grow. The S&P 500’s dividend yield would be 8 percent, as the first row of the display below shows.
If the P/E remained unchanged, the total return would also be 8 percent, but both the S&P 500 and the Dow would stay at their current level. While a flat index price might be disappointing, we think most investors today would probably welcome an 8 percent return on investment.

Of course, the companies in the S&P 500 do retain a portion of their earnings to finance growth, so the index’s dividend yield is slightly above 2 percent, rather than 8 percent, as the second row of the display shows. What kind of earnings growth should we assume?
What About Growth?
Historically, earnings and the stock market have grown with the economy over time, although they can diverge for several years at a stretch, particularly if market euphoria drives stock prices to very high multiples of earnings or if gloom drives stock prices to low multiples. Nominal U.S. GDP, which includes inflation, has grown 7 percent a year on average since 1947 — and so have the S&P 500’s earnings and price. (GDP growth is more commonly quoted in real, or inflation-adjusted, terms. We use nominal growth here to match data for earnings growth and the stock market.)
The three key variables that drive both economic growth and earnings growth over the long term are inflation (which increases the nominal value of economic output), population growth (which boosts the number of people consuming and producing goods) and productivity (which increases the output per person or per unit of capital).
Inflation is widely expected to average about 3 percent over the long term; population growth, to average about 1 percent; and productivity, to continue to rise about 2 percent per year. Since 3 percent + 1 percent + 2 percent = 6 percent, 6 percent is a plausible long-term economic growth forecast; it is actually below both the postwar average and the International Monetary Fund’s projections for the next five years.
So let’s assume 6 percent economic and earnings growth. With a constant dividend payout ratio, this would lead to 6 percent dividend growth. Eventually, this growth rate would probably make investors less gloomy, and the market would rise from its current low level of 12.5 times earnings.
If the S&P 500’s P/E rose to 15 — halfway back to its average of 17.6 since 1970 — the index’s expected return would be 9 percent per year. At that rate, the S&P 500 would reach 2,000 in five years. The Dow, which typically trades at about 10 times the S&P 500, would reach 20,000 in about five years.
But as discussed above, the market should arguably be trading at an above-average multiple, since bond yields are so low. If the S&P 500’s P/E rises to 20 times earnings as sustained growth in a low-interest-rate environment makes investors more confident, the Dow could reprice to 20,000 immediately, as the third row of the display shows.
Since most investors today would probably welcome an 8 percent or 9 percent return for the next five to 10 years (let alone an immediate market revaluation), the current limited appetite for stocks suggests that investors don’t believe in these scenarios. Most likely, they don’t believe in the consensus forecast of $104 in earnings per share this year or 6 percent economic growth. So let’s examine the implications for stock returns of lower earnings and slower economic growth.
What If Earnings Fall or GDP Growth Slows?
Many people expect earnings to decline because margins are far higher than usual. If corporate spending picks up from the unusually low levels of recent years, margins would fall, and that could drive down earnings.
We think it’s reasonable to expect margins to decline somewhat — although not necessarily to their historical average. But for the sake of argument, let’s look at what would happen if margins declined from 9.5 percent today to their long-term average of about 6.75 percent.
Even in this scenario, the S&P 500 would reach 2,000 and the Dow would reach 20,000 in about 10 years. Applied to current revenues, 6.75 percent margins would reduce S&P 500 earnings by about 30 percent — to $74, as the fourth row of the display shows.
While there would likely be a severe market pullback initially, if normal economic growth resumed and P/E ratios normalized, the S&P 500 would have a 5 percent total return and reach 2,000 in 10 years.
But the global economy is now weak, and the European sovereign-debt crisis could end up being a drag on economic growth for years. What if Europe and the US enter a lengthy period of disinflation? That’s possible, particularly if policymakers are unsuccessful at addressing the world’s serious macroeconomic problems.
So let’s perform a stress test and assume inflation of only 1 percent, population growth of 1 percent and no productivity growth at all. That would give us nominal GDP growth of just 2 percent. A recent survey of professional forecasters said there’s less than a 10 percent chance that economic growth will be that slow over the next three years.
What would these dismal economic forecasts imply about future earnings growth and stock returns? If we assume the S&P 500 earns $74 per share this year, 2 percent growth would still get us to a 4 percent annualized market return if the market P/E ultimately returns to average, as the fifth row of the display shows. At that rate, it would take 20 years for the S&P 500 to reach 2,000 and the Dow to reach 20,000. Such returns are hardly enticing, but they are still likely to exceed bonds.
Of course, stock-market returns could be worse than 8 percent (or 4 percent), particularly in the short term. S&P 500 earnings could fall below $74, and anxiety could cause market valuations to drop even further below normal; both happened in early 2009. Other market shocks are also possible. For example, very high inflation with slow growth could cause price-to-earnings multiples to contract.
But market returns could also be better. Our stress test incorporated draconian assumptions — a 30 percent drop in earnings plus no productivity growth at all, a very rare occurrence over a 10-year period. Human ingenuity has led to remarkably persistent and steady productivity growth in the postwar period. In recent years, new technology and globalization have driven productivity growth. In the future, these trends and others not yet imagined are likely to continue to drive it.
Faced with uncertainty and traumatized by losses in recent years, investors who are avoiding stocks appear to be assuming that the worst outcomes are highly likely to occur. Or, perhaps, they’ve just lost their stomach for market volatility and are prizing near-term stability over potential long-term gains.
The views expressed herein do not constitute research, investment advice or trade recommendations and do not necessarily represent the views of all AllianceBernstein portfolio-management teams.
Seth J. Masters is Chief Investment Officer for Asset Allocation at AllianceBernstein and Chief Investment Officer of Bernstein Global Wealth Management, a unit of AllianceBernstein.