Investors today have good reason to worry about stocks. Europe, the U.S. and emerging markets are facing real problems today — and economic recoveries after financial crises almost always take longer than recoveries after ordinary downturns. The global economy may take several more years to fully recover from the credit crunch, and so may the stock market. Both could weaken again before getting better.
Indeed, our research has found that after 15 systemic banking crises around the world, the stock market took nine years on average to regain its prior peak. We don’t know if the recovery from the recent crisis will take a longer or shorter time than average, but assuming it is average, we’re now about halfway through.
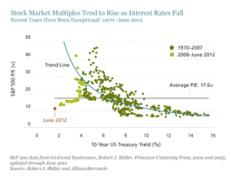
But even taking these risks into account, we don’t agree with those who argue that the stock market is overvalued. To begin with, it doesn’t make sense to say the market is expensive, given where bond yields are today. The display below shows the remarkably close relationship between the S&P 500’s price-to-earnings (P/E) multiple and the 10-year U.S. Treasury yield since 1970. (The curved trend line shows the average P/E for a given level of interest rates.) In general, stock market valuations have been high when interest rates were low, and low when interest rates were high, for good fundamental reasons.
Low bond yields tend to reduce companies’ borrowing costs. They also drive up the present value of future earnings and dividends, and they make bonds a less appealing alternative to stocks. High bond yields, by contrast, drive up companies’ borrowing costs, reduce the present value of their future earnings and dividends, and make bonds more appealing relative to stocks.
Since the beginning of 2008, 10-year Treasury yields have been below 4 percent, and the market P/E has been far below the trend line almost all the time, as shown by the light green squares in the display. The few light green squares above the trend line are for very late 2008 and 2009, when earnings fell to very low levels.

In June 2012, the 10-year Treasury yield was below 1.5 percent and the S&P 500’s P/E was 12.5, far below and to the left of the trend line. It’s the green dot in the display, the extreme outlier. To fit on the trend line, the S&P 500’s P/E would today have to quadruple, to about 50. While we certainly don’t think the market should be trading at 50 times earnings, today’s low bond yields suggest that the market should be trading at or above 17.6 times earnings, its average multiple since 1970.
Many people cite the Shiller cyclically adjusted P/E ratio as evidence that the stock market is too expensive. This backward-looking metric compares stock prices with inflation-adjusted 10-year trailing earnings. However, the last 10 years were not typical: Earnings were depressed by the recession in late 2008 and 2009. We think it’s important to be forward-looking.
The views expressed herein do not constitute research, investment advice, or trade recommendations and do not necessarily represent the views of all AllianceBernstein portfolio-management teams.
Seth J. Masters is Chief Investment Officer for Asset Allocation at AllianceBernstein and Chief Investment Officer of Bernstein Global Wealth Management, a unit of AllianceBernstein.