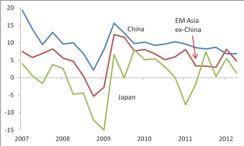
Since the beginning of August, markets have drawn support from a mild improvement in the U.S. economic data flow and from the possibility of aggressive European Central Bank action against the euro area crisis. The third major issue that investors have monitored over the past year — the slowdown in China — has moved to the sidelines lately, as recent information has not suggested any great worsening of the picture there. At the same time, the Chinese business cycle dynamic has failed to improve, defying hopes that have been in place for many months. Meanwhile, growth elsewhere in Asia has weakened: Japan has already experienced its bounce-back after the earthquake and tsunami; India is suffering from policy-related malaise; and cyclically sensitive Asian economies like Korea and Taiwan are feeling a chill from sluggishness elsewhere (Chart 1). Asia as a whole thus represents a headwind for a global economy that otherwise appears to be picking up at the margin after a very weak second quarter of 2012. Asia-sensitive asset classes — like emerging-markets equities, local-currency emerging-markets debt, industrial commodities, and materials-related sectors of the S&P 500 — seem unlikely to outperform until the Asian business cycle has passed convincingly through an inflection point toward reacceleration.
Chart 1: Real GDP (% q/q, saar)
Source: JPMSI, JPMAM; data through 12Q2 |
Asian weakness falls into four distinct geographic categories: China, Japan, India, and the smaller economies.
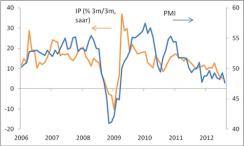
Timid policy easing is keeping Chinese growth well below trend. The Chinese economy has been running at a sub-par clip since early 2011, and growth dipped below 7 percent (in quarter-on-quarter terms) in the first half of this year. Whether this performance constitutes a “hard landing” or not depends entirely on definitions, but the Chinese slowdown has unquestionably been both longer and deeper than most observers (including us) had anticipated. Relative to expectations, the Chinese authorities took longer to shift into policy-easing mode and have delivered less support. Their cautiousness likely reflects a combination of lingering inflation fears, worries about creating the kinds of excesses that developed after the massive 2009 stimulus program, and perhaps organizational issues ahead of this year’s leadership transition. Moreover, given the ongoing slowdown in the Chinese property market, the economy’s responsiveness to a given amount of monetary policy easing may have dropped. Preliminary evidence about the third quarter does not seem very encouraging: The July round of data, including industrial production, looked soft, and the PMIs dropped in August (Chart 2). Indeed, the privately produced manufacturing PMI fell to its lowest level since early 2009. Incremental policy easing will likely feed through to the economy eventually, and the second half of 2012 as a whole will likely feature slightly stronger growth than the first half of 2012, but a definitive inflection point may be a few more months in the making, and growth will likely remain below its medium-term trend (of roughly 9 percent) until early 2013.
Chart 2: China industrial production and PMI
Source: JPMSI, Bloomberg; data through August 2012 |
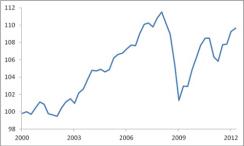
Japan has had its recovery. The Japanese economy suffered greatly from the earthquake and tsunami in early 2011. As it normalized, it grew rapidly in the third quarter of 2011 and — following another stumble in late 2011 as flooding in Thailand disrupted Asian supply chains, especially in the car sector — again in the first quarter of 2012. GDP jumped 5.5 percent in the first quarter of 2012. With economic activity now above its pre-earthquake level, though, this normalization boost has run its course (Chart 3). GDP growth cooled to a 1.4 percent clip in 12Q2, and survey data for early in the third quarter point to further deceleration. A general election and a fairly large increase in the consumption tax both loom on the horizon. While the Bank of Japan has turned more aggressive in recent months, it has not yet succeeded in driving down the value of the yen or pushing inflation expectations firmly into positive territory. From here, the Japanese economy seems likely to expand at a rate close to its medium-term trend, believed to be in the neighborhood of 1 percent — not disastrous, but not a great benefit to the rest of the world, either.
Chart 3: Japan real GDP (2000 = 100)
Source: JPMSI, JPMAM; data through 12Q2 |
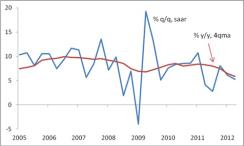
India is in a funk. In the past two years, India has followed a path somewhat similar to China: rapid growth after the recession led to an inflation problem that in turn triggered monetary policy tightening that slowed growth in 2011. Additionally, though, structural factors seem to be affecting the economy. Uncertainty about various aspects of economic policy appears to be dampening business confidence and investment, and potential growth may have slowed as a result. Quarter-on-quarter growth has run below 7 percent for the past four quarters, dipping below 6% in the first half of this year (Chart 4), without yet making a significant dent in inflation. The Reserve Bank of India is therefore proceeding cautiously with policy easing. Reacceleration likely depends on an improved political atmosphere. Until this change materializes, growth will likely run well below the 8-9% clip previously considered to be India’s norm. Luckily, in contrast with China, the relatively closed nature of India’s economy means that this weakness will not spill over significantly to other economies in Asia or elsewhere, though India in itself does represent an important country for many investors.
Chart 4: India real GDP
Source: JPMSI; data through 12Q2 |
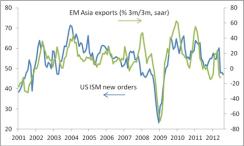
Cyclically sensitive economies are under pressure from elsewhere. Other significant Asian economies, such as Korea and Taiwan, depend heavily on exports. They are currently suffering less from home-grown problems and more from the downturns in the large Asian countries and the euro area. In both Korea and Taiwan, real GDP growth averaged a weak 2.5 percent in the first half of 2012. Early evidence from the third quarter looks mixed. PMI levels remain depressed, and data for exports and industrial production point to, at best, stability. An inventory correction in manufacturing that has taken hold in recent months may soon run its course, but a strong pickup in these globally sensitive economies will depend on improvement in the global manufacturing cycle and in final demand both within the region and around the world (Chart 5).
Chart 5: EM Asia exports and U.S. ISM survey new orders component
Source: JPMSI, JPMAM; data through August 2012 |
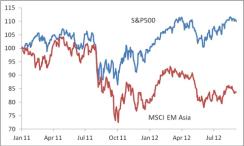
Business-cycle weakness has constrained EM Asian equities, which participated in the U.S.-led rally early in the year but which have lagged since (Chart 6). With Asia representing nearly 60 percent of the MSCI EM index, overall emerging-markets equities have underperformed the U.S. for a second consecutive year. Other Asia-sensitive markets have also struggled. The copper price has moved sideways in 2012, and emerging-markets currencies have barely moved after depreciating significantly in 2011. Within the S&P 500, the Asia-exposed materials sector has risen by only about half as much as the overall market thus far in 2012. All of these markets should benefit strongly from an eventual improvement in Asian growth. With Japan and India facing internal difficulties and the smaller Asian economies hostage to foreign demand, hopes for such a pickup rest heavily on China. As always, investors will monitor the evolving dynamic of policy change in China and the economy’s response. Convincing reacceleration, though, may need to wait for 2013.
Chart 6: S&P 500 and MSCI EM Asia (1 Jan 2011 = 100)
Source: Bloomberg; data through September 4, 2012 |
Opinions and estimates constitute our judgment and are subject to change without notice. Past performance is not indicative of future results. The material is not intended as an offer or solicitation for the purchase or sale of any financial instrument. J.P. Morgan Asset Management is the brand for the asset management business of JPMorgan Chase & Co. and its affiliates worldwide.