Coming into this year, we held a favorable tactical view of emerging-markets equities (EME). The MSCI Emerging Markets Index (MSCI EM) underperformed the S&P 500 in price terms by 20 percent in 2011, primarily because of monetary tightening cycles that slowed growth in several large EM economies, including China, Brazil, and India. With that tightening process having run its course, and in placed give way to easing, we expected the resulting growth reacceleration, in a context of favorable valuations, to generate EME outperformance.
This story appeared to be working well in January and early February, with EME scoring significant gains in relative terms (Chart 1). Since then, though, EME has slipped compared with the S&P 500. By late April, EME had given up all of its relative increase. A modest uptick in the past few days notwithstanding, EME has basically only kept pace with U.S. equities thus far during 2012.
Chart 1: MSCI EM vs. S&P 500 (1 Jan 2010 = 1)
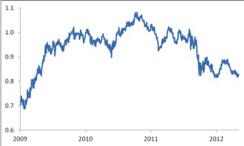
Chart 1
Source: Bloomberg; data as of May 3, 2012 |
1. Guilt by association for Central and Eastern Europe. Logically, the euro area’s woes should be taking a toll on overall EME performance, given that the overall MSCI EM index contains a number of countries in that region. On closer examination, though, this does not explain much of this year’s disappointment. The entire EMEA region accounts for just 18 percent of MSCI EM, and the only two individual EMEA countries with greater than a 2 percent weighting in the index, South Africa and Russia, not only stand on the periphery of the region but also have not done too badly this year (Chart 2). The euro area probably does constitute a drag for EME but not a gale-force headwind.
2. EM central banks’ participation in the "currency wars." Several major EM central banks have been leaning aggressively against currency appreciation, given their fears that very easy G7 monetary policies are creating a flood of capital inflows that will damage their competitiveness. Brazil has been among the most vocal and active in this respect, and the Brazilian real has indeed weakened about 3.5 percent this year. EM Asian currencies, for their part, have broadly treaded water in 2012, mirroring the behavior of the Chinese renminbi, which has barely moved. Resistance to currency appreciation has dampened dollar-denominated returns on EME. Again, though, the effect looks somewhat marginal. EM currencies as a group have posted small gains against the dollar year-to-date (that is, MSCI EM in dollar terms has outperformed its local-currency equivalent). They simply have done less well than might have been expected considering their weakness in 2011.

3. Concerns in specific countries. Brazil stands out as a conspicuous underperformer, with a 4 percent YTD increase. Of course, currency depreciation accounts for some of the lag relative to the MSCI EM, but ongoing worries about the effect of public policy on company results (earlier concentrated in the oil sector but now more focused on the banks, given the government’s efforts to narrow net interest margins) have also played a role. Although India has performed roughly in line with overall EME this year, doubts about the policy framework and its influence on private investment spending have damaged sentiment there. Russia also faces an uncertain political climate, a major issue for an equity market dominated by state-influenced, -owned, or -regulated companies. This set of concerns, affecting three of the seven largest components of the MSCI EM, probably will not fade anytime soon, though it also appears unlikely to intensify.
4. China. Ongoing uncertainty about business-cycle conditions in China represents perhaps the largest contributor to this year’s relative EME disappointment. The China story simply has not moved forward as quickly as had been expected. While policy easing began at the end of 2011, it has proceeded in timid fashion thus far as the authorities confirm that inflation has slowed. With the housing sector still in retreat, economic growth dipped below 7 percent (in sequential and annualized terms) in the first quarter of this year. Doubts about Chinese growth have affected not only the local market but also much of the rest of EM Asia as well as commodity exporters in other regions.
We continue to expect gradual improvement in Chinese growth. Policy has continued to ease, with more action behind the scenes (in terms of credit guidance) than through high-profile measures (like reserve requirement cuts). The authorities have recently affirmed their intention to support growth. And the most recent data — March monthly activity indicators and April purchasing managers’ indexes — suggest an upturn. With the world still looking like a complicated place and policy moving relatively slowly, a convincing upturn will likely not occur until around mid-year. Improving growth prospects for China and its neighbors, as well as the resulting greater support for commodity producers, will likely facilitate renewed EME outperformance in the second half of 2012.
Chart 2: Individual country performance within MSCI EM (%, year-to-date)
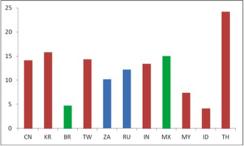
Chart 1
Source: Bloomberg, JPMSI; data through May 3, 2012. The 11 largest MSCI EM components are shown. |