With a combined 30-plus years of experience at investment banks, financial exchanges, asset management firms and journalistic enterprises between the two of us, we have learned to treat both Wall Street research and media reports on the markets with a bit of skepticism. The human brain is a pattern-finding machine; thus when markets do things that do not make immediate sense, researchers and others pressed with publication deadlines sometimes torture the data enough to come up with false, coerced confessions from suspects who were in the vicinity but are not the true culprits.
One such example is the recent identification of corporate pension long-duration buying as the reason behind the counterintuitive 2014 decline in long U.S. Treasury yields. This trend yielded, as it were, a number of inquiries from large issuers, the media, heads of Wall Street trading desks who doubted what their own research guys were telling them (not unprecedented) and clients who would say, “It’s not us, but is it true that it’s our peers?” Whereas there is indeed strategic long-term buying of long bonds, as we have written about repeatedly in the past (see, for example, “Who’s Buying Now? Some Long-Term Investors Are Snapping Up Bonds”), both the press and the Street have missed a couple of key facts:
• Although as a group, corporate pensions and, to a lesser degree, life insurers are still decidedly short-duration in contrast to their liabilities, they are level-sensitive and trade counter to trend. They buy more as rates rise (and their funding levels improve), and they tend to slow buying programs as yields fall.
• The vast majority of their buying — 80 to 85 percent — is long corporate bonds, not Treasuries. Indeed, we have seen a recent pickup in underlay programs: shorting futures or swaps against long corporate bonds as a strategic way to increase the long credit that hedges liabilities while taking a tactical view that rates are too low to fully hedge duration (see “Delayed LDI Implementation: Making It Worth Your While”).
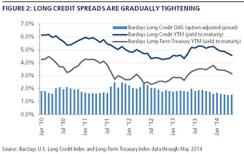
This story is borne out by the following charts. Chart 1 shows PIMCO’s 12-month rolling net flows in long-duration assets, and chart 2 plots the yields of the Barclays Capital U.S. long credit index and the long-term Treasury index and the spread between them.
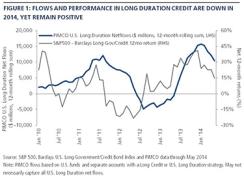

Most of our clients in this segment are corporate pension plans. We manage money for more than 80 percent of the 50 largest plan sponsors, including long-duration strategies for more than two thirds of that group. Chart 1 shows a noticeable upswing in net inflows in the second half of 2013, when yields were rising. For the 2013 calendar year, we saw more than $14 billion in net flows into long credit. Note that since the start of 2014, even though flows have been positive, they have fallen off their pace from 2013. Also note that the flows series lags the rolling net performance of U.S. equities, less the Barclays U.S. long government credit index, a directional proxy for changes in aggregate plan funded status. Pension plans tend to invest more in long credit as funding improves and as a way to slow their purchases as funded status fades.
Looking at charts 1 and 2 together, we see that the period of low-to-negative net flows from mid-2012 through early 2013 also coincided with a yield on the long credit index of less than 5 percent. As expected returns run through corporate income statements, and the desired forecast of future bond returns is yield, it would stand to reason that corporations would slow or curtail buying when absolute yields become too low, as some observers have described. Note, however, that even as buying slowed, long credit spreads continued to grind tighter.
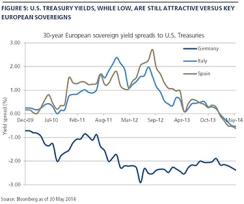
So if pensions are not buying long Treasuries, what is driving the precipitous fall in 30-year yields, despite a U.S. Federal Reserve that is winding down its quantitative easing program?
One motivation for adding exposure to Treasuries during this time is outlined in our thesis, which we call the New Neutral. It is a rather simple proposition: In an economy saddled with higher levels of debt and leverage, a lower risk-free rate is necessary to support levels of activity similar to those before the crisis. With 2014 being seen as a year of policy transition (from balance sheet expansion to qualitative guidance), investors started with an underweight to Treasuries, assuming that the next move from the Fed would be a return to the familiar levels of the fed funds rate seen before the 2008–’09 crisis. Yet the warnings from Fed officials on the fragility of the recovery never jibed with that market posture. Eventually, investors reckoned that what had been appropriate in an era of credit expansion differs from what is required in a system needing to delever (see PIMCO’s May 2014 investment outlook, “Achoo!,” and the June 2014 Macro Perspectives entry, “Just Give Me a Framework”). Essentially, one could partially explain the rally through the filter of the marketplace’s recalibrating the end-state of Fed policy reversal. But it is worth studying the composition of that buying to better understand why Treasuries have outperformed so many people’s expectations.
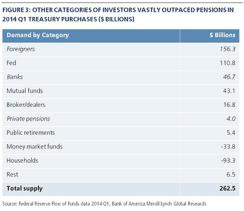
With the Fed’s June 5 release of first-quarter 2014 flow of funds data, we are able to see which cohorts increased their Treasury footings the most (see chart 3). And sure enough, pensions are nowhere near the top of that list. Rather, foreign investors accounted for nearly 60 percent of Treasury purchases during the first three months of the year, outpacing even the Fed’s massive quantitative easing efforts. Behind those two came banks, likely driven by both regulatory considerations and having been caught on the wrong side when the rally began.
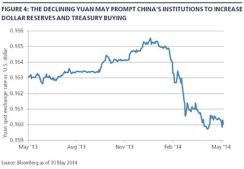
Two primary factors seem to be motivating the increase in foreign positioning. First, the steep decline in the yuan (see chart 4) accelerated the pace of U.S. dollar reserve accumulation, enticing buying by official institutions. Even before the exchange rate moved, regulatory efforts to curb shadow banking in China led private market participants to seek liquidity offshore, in turn leading to an increase in demand for Treasuries. Second, the fundamentals in Europe had caused a sharp decline in long-term rates across the Continent, ultimately making the yield pickup into the U.S. appetizing for crossover buyers, despite its low absolute level (see chart 5).
Domestic banks were compelled to increase their footings in Treasuries for two main reasons. First, they entered the year with a fairly aggressive short position in the asset class, inspired by optimistic growth outlooks and concerned that the Fed would have to become more hawkish in response. This became a rather crowded trade. Nearly all strategists were predicting higher rates to prevail throughout 2014. When the buying appeared from overseas, that put pressure on those positions, and dealers scrambled to get back to neutral. It became a self-reinforcing phenomenon as more new buying created more short-covering. To a lesser extent, the increased capital requirements associated with implementation of the 2010 Dodd-Frank Wall Street Reform and Consumer Protection Act also sparked demand for Treasuries. It is hard to pin down the timing, but as more derivatives trading migrates to central clearing, the demand for high-quality collateral increases too.
These explanations fit best when we look at the price action year-to-date. But they still leave an incomplete picture because they fail to address the massive structural change in the market, which is likely the prime cause of the extent of this year’s long bond rally.
Risk transfer in fixed-income markets takes place through the dealer community, which provides liquidity to facilitate the changing preferences of end users. When dealers act as principal in a transaction, they hold onto the security sold to them for a time before a buyer comes along to purchase that security for its own needs. When dealers instead act as agents, they merely line up the seller with a buyer on the other side, taking out a bid-ask spread along the way. In the former instance, the dealer is acting as a shock absorber in the system, as end users have different time horizons and other barriers to always being ready to identify a price at which they’d provide liquidity. In the latter case, there is no shock absorber and the price at which a dealer can pass the risk straight through from one end user to another is naturally more distant. In this example, the provider of liquidity is an end user whose role in the market has historically been a consumer of liquidity. Now, in their new role, dealers command a premium to fill the void.
Deleveraging in the financial system has created a safety net against future crises. But it has unintentionally left a vacuum of liquidity in its place. The agent-based model of risk transfer was likely a dominant factor in last summer’s sell-off — the “taper tantrum” — as the dealer community was not interested in warehousing the risk that end users were shedding. Similarly, this year’s unexpected rally was no doubt exaggerated by the unwillingness or inability of dealers to act as principal. Their desire to maintain small balance sheets leads to echoes in the market when end users appear. This causes the basis point impact of larger flows to increase — and actually begets more flows, in a circular fashion. Think of it as another form of liquidity trap. In essence, we find ourselves operating in a system that doesn’t value countertrend trading but, rather, is dominated by momentum.
In response to these dynamics, one has to identify both risks and opportunities. The predominant risk boils down to scaling. With idiosyncratic volatility a higher likelihood, it makes sense for portfolios to diversify their expressions so one position doesn’t dominate performance potential. This also puts the spotlight on the main opportunity provided by this system: to fill in as liquidity provider where others no longer can. Recognizing that a void is left by the loss of principals in the market should benefit fixed-income portfolios over time as they seize the chance to be a price setter in the new regime.
James Moore is a managing director at Pacific Investment Management Co. ’s Newport Beach, California, headquarters; leads the global liability-driven investments product management team; co-heads the investment solutions group; and is the firm’s pension strategist.
Stephen Rodosky is a managing director at PIMCO’s Newport Beach headquarters and a portfolio manager covering Treasury bonds, agencies and futures. He is the firm’s portfolio manager for long-duration strategies.
Get more on fixed income.