Institutional investors could be forgiven for being somewhat puzzled by Brazil. The country continues to be an emerging-markets equity underperformer while battling a combination of stubbornly high inflation and disappointingly weak growth.
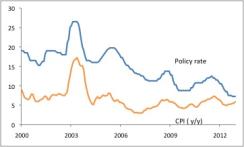
As widely expected, on January 16 the Brazilian central bank’s monetary policy committee (Copom) left its benchmark Selic interest rate unchanged. Copom also left intact the language in its statement referring to the probability that rates will stay stable for an extended period. The current level, 7.25 percent, represents a trough for the inflation-targeting era. Copom has taken advantage of global disinflationary forces in the postrecession period, along with the credibility built up in the 2000s, to complete the convergence of Brazilian interest rates with the global norm. After a hiking cycle that began in 2010, Copom cut rates by 525 basis points over 2011 and 2012. The real policy interest rate averaged roughly 10 percent for the decade after the 1999 introduction of the inflation target but now stands in low-to-mid single digit territory (see Chart 1).
Chart 1: Brazil policy interest rate and consumer prices (%)
Source: JPMSI; data through December 2012 |
Beyond the next few months, during which Copom will likely stick by its stability-signaling language, the outlook for rates seems unclear. Indeed, while some analysts expect a hike as the next move, others forecast renewed cuts as early as the first half of this year. This uncertainty reflects the combination of circumstances currently facing the Brazilian economy, with stubbornly high inflation alongside disappointingly weak growth. Brazilian equities have significantly underperformed the MSCI EM index in recent history, down more than 22 percent in 2011 and still lagging the markets in 2012 when other emerging markets were on the upswing.
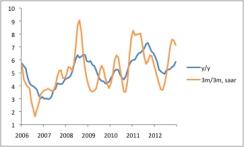
On the inflation front, consumer prices rose 5.8 percent year-on-year in December, more than a percentage point above the 4.5 percent middle of the inflation target range. Indeed, the headline inflation rate has dipped below 4.5 percent in just one month since the beginning of 2010, and just barely at that (4.49 percent in August 2010). Between April and November 2011, inflation ran above the 6.5 percent top of the target zone. While currently inside that range, inflation has drifted upward in recent months, with the sequential run rate topping 7 percent throughout the last quarter of 2012 (see Chart 2).
Chart 2: Brazil consumer prices (IPCA, %)
Source: JPMSI; data through December 2012 |
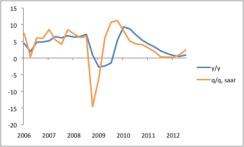
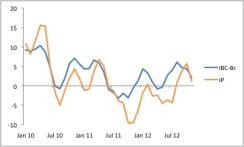
While Copom’s rate-cutting cycle in the presence of above-target inflation might seem unusual, monetary policymakers have also been wrestling with persistent sluggishness in economic activity, which seems to be weighing on market returns. In quarter-on-quarter, annualized terms, GDP rose less than 3 percent in each of the six quarters to the third quarter of 2012, with the most recent year-on-year rate just 0.9 percent (see Chart 3). The economy did pick up somewhat in sequential terms in the third quarter, but not very impressively given the aggressive monetary easing. Monthly data, if anything, suggest renewed deceleration in the fourth quarter (see Chart 4).
Chart 3: Brazil real GDP (%)
Source: JPMSI; data through 12Q3 |
Chart 4: Brazil monthly GDP and industrial production (% 3m/3m, saar)
Source: JPMSI; data through November 2012 |
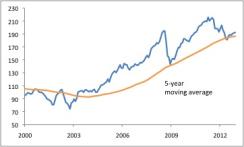
Why has the economy responded in such muted fashion to rate cuts (not to mention fiscal stimulus, also implemented in 2012)? The now-heavy burden of household debt may be dulling monetary transmission. The global backdrop, with ongoing weakness in manufacturing and limited gains in commodity prices, has not helped. And the currency, which still looks quite elevated by longer-term standards (see Chart 5), probably represents an ongoing drag, though its current level is not far from its average over the past five years.
Chart 5: Brazil real effective exchange rate (2000 = 100)
Source: JPMSI; data through December 2012 |
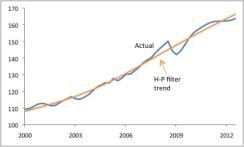
Near-term cyclical considerations aside, the relationship between growth and inflation poses a deeper structural question. Why, with economic activity so weak, is inflation running significantly above the target? A simple Hodrick-Prescott filter calculation implies a fairly significant output gap, reaching some 1.6 percentage points of GDP in the third quarter of 2012. Inflation, however, rose near the end of last year. This divergence points to the possibility that potential growth has slowed to an anemic pace recently, such that the economy is not actually generating much slack even though it is expanding at a sub-1 percent clip. The government’s turn toward a more assertively interventionist stance in the past few years might help account for deterioration in potential growth, in particular by depressing capital spending (and possibly by making state-company investment less efficient). A conclusion that potential growth has decelerated would bode poorly for Brazilian asset market return prospects.
Chart 6: Brazil real GDP and Hodrick-Prescott filter trend (1995 = 100, sa)
Source: JPMSI; data through 12Q3 |
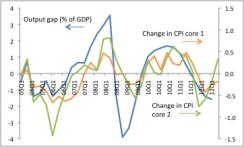
A more careful look at inflation, however, suggests a less unfavorable story. While headline inflation has been stable and did move up at the end of 2012, core inflation measures have been moving in the opposite direction. Core inflation generally slowed throughout last year, though the measure of core inflation “by exclusion” (somewhat akin to a U.S-style core, removing gasoline and some foods) did accelerate in the fourth quarter. In any case, the relationship between the implied output gap from the Hodrick-Prescott filter and core inflation does not appear to have changed significantly (see Chart 7). By this simple metric, then, potential growth may be holding steady.
Chart 7: Brazil GDP output gap and change in core CPI inflation (%)
Source: Banco Central do Brasil, JPMSI; data through 12Q4. CPI core 1 is trimmed means; CPI core 2 is by exclusion. Change is the difference in quarterly average year-on-year rate versus previous quarter. |
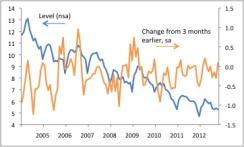
Several factors, however, should temper any enthusiasm resulting from this calculation. First, a few one-off policy moves helped cut inflation during 2012, including VAT exemptions for durable goods. The IPCA methodology also changed, with a shift in weights producing a slightly lower inflation outcome than would otherwise have been the case. In other words, the relationship between the output gap and “true” underlying inflation may indeed have worsened. Second, a glance at the behavior of the labor market also suggests very weak potential growth. The unemployment rate fell through most of 2012 and, at most, stabilized in the final months of the year. Below-potential growth normally puts upward pressure on joblessness, and even if the labor market operates with long lags, it likely should have felt some effect from the output gap by late 2012. Third, the H-P filter exercise itself points to distinctly soft, even if not necessarily slowing, potential growth. This method generates an implied trend rate of just 3.1 percent, sufficient to improve living standards gradually but not enough to make quantum progress in closing the income gap between Brazil and the developed world. Admittedly, against a backdrop of roughly 1 percent OECD growth, 3 percent may seem reasonable, but investors in Brazil likely hope for better.
Chart 8: Brazil unemployment rate (% of labor force)
Source: JPMSI; data through October 2012 |
Markets are focusing at the moment on the central bank’s reaction function, in particular its reluctance to raise rates to guide inflation back toward the target — a seeming shift from the previous administration. Longer-term investors, however, need to pay greater attention to the message from the overall data flow. The possible deterioration in the activity-inflation tradeoff may mean that Brazil’s already fairly low potential growth rate has slowed further. The next few quarters will provide crucial evidence. The economy may eventually respond vigorously to the previous round of interest rate cuts. Alternatively, inflation might drop more quickly toward the target. Continuation of the current mix — disappointingly low growth, frustratingly steady inflation — would likely compel investors to revise downward their expectations for long-term returns in Brazilian markets.
Michael Hood is a Market Strategist for J.P. Morgan Asset Management.