Despite considerable angst about low yield levels and talk of a “great rotation” from bonds to equities, fixed-income assets as a group have not performed badly thus far in 2013.
U.S. Treasuries, and by extension the Barclays Capital Aggregate Bond Index, have delivered slightly negative total returns (–0.6 percent in the case of Treasuries), with U.S. investment grade credit roughly flat and higher-yielding assets posting strong gains. U.S. high yield remains on a tear, with a 2.9 percent year-to-date return, and both European high yield and U.S. leveraged loans are up about 2 percent.
Against this backdrop, emerging markets debt, in particular the “sovereign” category (hard-currency denominated government debt), sticks out. The JPMorgan EMBI Global Diversified Index (EMBIG-Div) has dropped 2.1 percent year-to-date in total return terms, by far the worst performance among major fixed-income asset classes (Chart 1). While the U.S. Treasury sell-off explains part of the loss in emerging market debt, EMBIG-Div spreads have widened steadily in 2013, while yield spreads on investment grade debt have moved sideways and spreads on high-yield debt have continued to tighten (Chart 2).
Chart 1: Fixed-income returns, YTD (%)
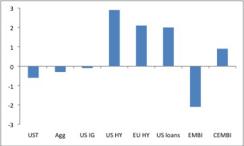
Chart 1
Source: Bloomberg; data through March 20, 2013 |
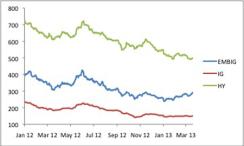
Chart 2
Source: Bloomberg; data through March 20, 2013 |

• Duration fears. Given the low level of Treasury yields and their rise thus far in 2013, investors might be looking to shed long-duration assets. But the EMBIG-Div, our proxy for the sovereigns, has almost exactly the same duration (a bit more than seven years) as the U.S. investment grade index, which has held up well in total return terms and has experienced modest spread tightening this year.
• Generalized emerging markets worries. Perhaps investors have grown concerned about emerging markets in general, relative to U.S.-based assets. This notion seems somewhat appealing given that emerging market equities have also struggled in 2013. But emerging market corporate debt (labeled as CEMBI in Chart 1) has done well, posting a 0.9 percent return (year-to-date), with its investment grade and high-yield components tracking their U.S. counterparts closely. Emerging market creditworthiness concerns should affect corporate borrowers just as much as or more than their sovereign counterparts. Local-currency emerging market debt has also held up much better than hard-currency obligations, down 0.2 percent (year-to-date) despite yen depreciation, which has put pressure on several emerging market currencies and should represent a disproportionate negative for local-currency bonds.
• Country-specific problems. Sometimes one or a small number of countries represented in the emerging market bond index run into severe difficulty, affecting the entire index. This year, Argentina’s legal problems, which could result in technical default, have attracted considerable attention, and the Argentina sub-index within the EMBIG-Div has widened 211 basis points (year-to-date). But this disaster only accounts for 0.2 percentage points of the overall decline in the index. And as a group, spreads on the EMBIG-Div’s high-yield credits have widened less than those of investment-grade sovereigns. Indeed, poor performance has been quite widespread across the EMBIG-Div. Of the 24 countries that each represent at least 1 percent of the index, 22 have seen spreads widen in 2013, with a median move above 30 basis points (Chart 3).
Chart 3: EMBIG-Diversified country sub-index spread change YTD (bp)
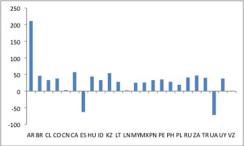
Chart 3
Source: Bloomberg; data through March 20, 2013 |
Investors looking for a bit of yield in today’s fixed-income landscape may have felt forced to go further down the credit spectrum to generate a satisfactory-looking income stream. At the same time, the emerging market debt asset class probably still enjoys less day-to-day sponsorship than other fixed-income categories. Even at very low yields, for example, investment-grade credit continues to benefit from insurance company buying and from inflows associated with de-risking pension funds. By contrast, few investors “have to” buy emerging debt. Fund flow data for the past few months do suggest a falling-off of emerging market sovereign debt purchases after a very strong 2012.
Where does emerging market debt go from here? Undoubtedly, the 2 percent negative return on the EMBIG-Div in less than three months is a disconcerting development, especially considering the not particularly hostile backdrop. If this weakness indeed owes in part to continued lack of sponsorship, investors will need to factor this characteristic into future return and volatility expectations.
At the same time, the lack of obvious fundamental drivers for the sell-off means that relative valuation has likely improved. High-yield spreads have tightened 50 basis points thus far in 2013, compared with a 30-basis-point widening for emerging markets sovereign bonds. The latter now yields only about 90 basis points less than high yield despite considerably stronger credit quality. For investors willing to accept an asset class that may remain fundamentally a bit more volatile than some of its closest fixed-income counterparts, and who are thinking in terms of long holding periods, the 2013 stumble appears to have produced an attractive entry point.
Michael Hood is a market strategist for J.P. Morgan Asset Management.