China’s business cycle troughed late in the third quarter of 2012, with a steady pickup observed since then across the data flow. The improvement looks convincing if moderate. While growth likely remains below its medium-term potential rate, its pace almost certainly has accelerated from the average 7.1 percent gain in gross domestic product (in quarter-on-quarter, annualized terms) posted in the first three quarters of last year. Still, considerable uncertainty surrounds China’s prospects for 2013, which is no surprise considering that the country is experiencing transitions both short term (politically) and longer term (with trend growth likely slowing gradually), against a backdrop of continuing sluggishness globally.
The first pieces of data published for December suggest that conditions continued to improve at the end of last year. Still, they raise a series of questions about the outlook for coming months.
First, is M2 — broad money supply — becoming irrelevant?
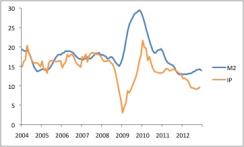
This question stems from the widely observed divergence between M2 growth in year-on-year terms, which slowed from 14.8 percent in September to 13.8 percent in December, and business cycle indicators, which turned upward during that same period (see, for example, industrial production in Chart 1).
Chart 1: China M2 and industrial production (% Y/Y)
Source: JPMSI; data through December 2012 |
China observers have long concentrated on bank-lending and money-supply data to gauge the availability of credit, swings in which have tended to generate inflection points in economic activity. As China’s financial system becomes more diverse, with various savings vehicles besides bank deposits and new sources of funding besides bank loans, this relationship may be breaking down.
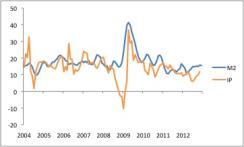
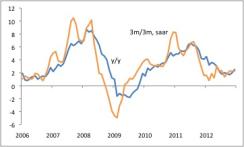
The answer to the question is probably, “Yes, but not yet completely.” Bank loans are indeed becoming less dominant in credit provision. They now account for just over half of the “total social financing” (TSF) measure published by the authorities, compared with about 70 percent before the financial crisis, with the share of bonds in TSF at nearly 14 percent today versus 8 percent back then. Still, bank loans remain the main source of credit for smaller companies and still represent an important policy lever for the monetary authorities. When looked at in sequential terms, M2 growth has accelerated recently. The seasonally adjusted annual rate (SAAR) from the latest three-month period compared with the rate from the immediately previous three months averaged 15.5 percent in December, remaining below its medium-term trend but representing a significant pickup from the 10.9 percent trough observed back in March. This by no means looks inconsistent with the ongoing improvement in economic conditions more broadly (see Chart 2). For the time being China observers probably need to pay ongoing attention to M2, while also keeping an eye on trends in the country’s developing capital markets. For the moment, developments in bond finance look supportive of near-term growth trends.
Chart 2: China M2 and industrial production (% 3M/3M, SAAR)
Source: JPMSI; data through December 2012 |
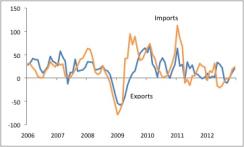
Second, what does the growth environment in the G3 nations (Germany, France and the U.K.) hold for China? Chinese exports jumped in December, with a 14.1 percent year-on-year gain, compared with 2.9 percent in November, translating to a seasonally adjusted increase of 7.3 percent, month-on-month. The size of this improvement raised a few eyebrows, considering the still-soft international context, though December’s rise followed a weak November, and the monthly change does not particularly stand out within the history of this choppy series (indeed, exports posted slightly larger one-month increases in both March and May 2012). In any case, after a soft patch in mid-2012, export growth appears to have reaccelerated fairly strongly as the year drew to a close, with import growth picking up simultaneously (see Chart 3).
Chart 3: China exports and imports (% 3M/3M, SAAR)
Source: JPMSI; data through December 2012 |
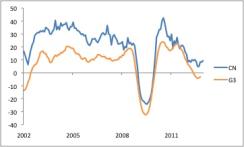
At the same time, this upward shift will prove unsustainable without corresponding improvement in the global business cycle, centered on manufacturing. China’s competitiveness at the time of WTO entry allowed it to gain significant market share globally in the years before the global recession, a steady support for overall Chinese growth. But those days are over, with Chinese wage costs having risen and the currency having appreciated. Chinese exports now grow only moderately faster than G3 imports (See Chart 4). In the absence of booming domestic demand from some source ultimately unrelated to exports, China needs at least a reasonably favorable international environment in order to sustain satisfactory local growth. Luckily, evidence from purchasing managers surveys suggests that the global industrial cycle has bottomed out after a brutal inventory correction that lasted much of 2012. With aggregate final domestic demand across the G3 also likely to post a small improvement on last year, G3 import growth should accelerate, facilitating a return toward trend-like growth for China this year.
Chart 4: China exports and G3 imports (% Y/Y, 3MMA)
Source: JPMSI, JPMAM; data through December 2012 |
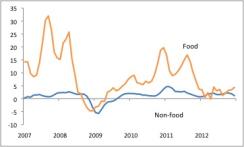
Third, will inflation represent a constraint on growth in 2013? The CPI acceleration in December prompts this question. Consumer prices rose 2.5 percent year-on-year, up from 2.0 percent in November and the highest reading since May. In sequential terms, inflation appears to be drifting higher, though at 2.3 percent in December its level still represents little cause for concern (see Chart 5). The fact that the December acceleration is owed entirely to food represents little comfort in itself, given that food drives most inflation cycles in China (see Chart 6). Still, unseasonably cold weather likely affected fresh food prices during the month, and the December increases were fairly narrowly based, with some payback likely in January.
Chart 5: China consumer prices (%)
Source: JPMSI; data through December 2012 |
Chart 6: China consumer prices by type (% 3M/3M, SAAR)
Source: JPMSI; data through December 2012 |
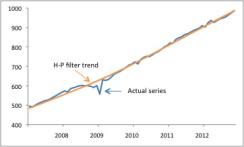
For the time being, inflation probably will not derail the economy’s growth acceleration. As mentioned, the December jump likely overstated the true degree of inflation pressure. Moreover, given the economy’s ongoing structural change, the authorities seem tolerant of a somewhat higher trend rate of inflation than in the past, with 4 percent likely to be the ceiling of the acceptable range. Some wiggle room thus exists. Still, strong growth would likely begin steering inflation upward fairly quickly. With China having been in overheating mode before the 2011 slowdown, the economy is probably operating with fairly limited slack. Industrial production, for example, is running quite close to its long-term trend line (see Chart 7). While already this year it seems like is growth unlikely to bump into an inflation constraint, by the second half of 2013 the authorities will likely have shifted the focus of monetary policy toward inflation control, with outright tightening measures possible toward the end of the year or in early 2014.
Chart 7: China industrial production (1990 yuan bn, SA) and Hodrick-Prescott filter trend
Source: JPMSI, JPMAM; data through November 2012 |
Putting these three questions together, the picture that emerges of the Chinese economy is one of (1) sufficient credit availability to support growth in the short run; (2) a need for ongoing global improvement to sustain the recent pickup in export growth; (3) room to grow, but with the possibility of changing monetary policy looming just off-stage. GDP growth will likely accelerate, averaging around 8.5 percent in quarterly terms through the course of 2013, while remaining well below the precrisis trend.
Michael Hood is a Market Strategist for J.P. Morgan Asset Management.