Hedge Fund Moneyball: Big Data, Sports and Finance

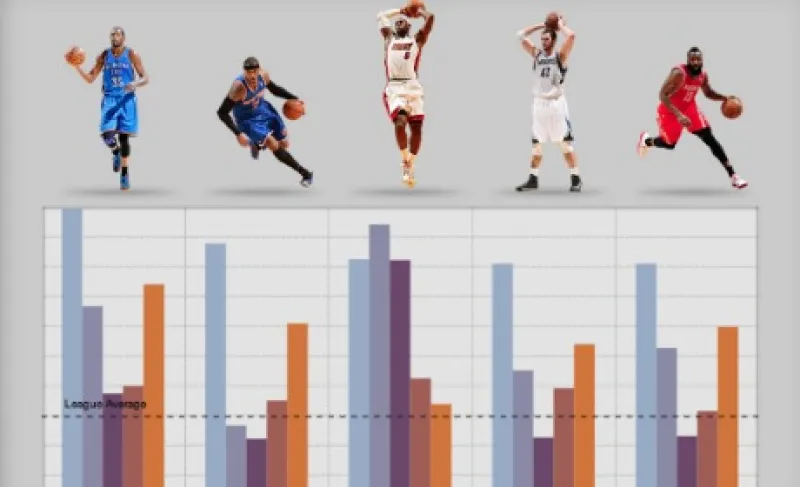
Soon institutional investors will track fund managers just as fans today can pore over the stats of LeBron James and Carmelo Anthony.

2013-12-daniel-nadler-nba-stats-large.jpg

In the 2011 Hollywood film Moneyball, based on the Michael Lewis book by the same name, Oakland A’s assistant general manager Peter Brand (played by Jonah Hill) tells his boss Billy Beane (played by Brad Pitt), “It’s about getting things down to one number. Using the stats the way we read them, we’ll find value in players that no one else can see. People are overlooked for a variety of biased reasons and perceived flaws. Age, appearance, personality. ... Mathematics cut[s] straight through that. Billy, of the 20,000 notable players for us to consider, I believe that there is a championship team of 25 people that we can afford, because everyone else in baseball undervalues them.”

Beane later declares, “We’re shopping in a new store — full of complicated statistical analysis and equations.”

Sabermetrics famously brought the quantification of play-by-play performance to professional sports. A slew of new technologies currently being tested by Major League Baseball and the National Basketball Association promises to take quantified athletic performance to the next level, allowing the consumers and clients of sporting activities — that is, the fans — to participate in measuring and metering every assist, basket, blocked shot, catch, pitch, rebound, run, swing and throw, with a view to how these swirling gusts of data might possibly predict the one simple ordinal outcome that everyone most cares about: the final score.

What is going on in sports technology today has obvious, and important, implications for institutional fund management. By employing high-speed analytics software to capture every movement and ounce of data on a player in real time, professional sports is getting into the big-data game with a view to boosting fan engagement via so-called second screen experiences (whereby you watch a game on one screen and use a second to track the statistical representation of what you are viewing). In the future institutional investors will be able to track fund managers using similarly sophisticated methods.

Since the advent of big data, professional sport leagues have explored ways to use the massive amounts of information they collect to maximize the consumer experience. Baseball recently introduced a new tool, Fieldf/x, developed by Sportvision, a company best known for its 1998 introduction of yellow first-down markers superimposed on broadcast images of football fields during games. Fieldf/x tracks and displays every movement of every player on the field via cameras installed throughout a baseball stadium.

Sportvision products are not new to baseball. Its K-Zone service is used by TV networks to display the location of pitches thrown during a broadcast. Its Pitchf/x product broadcasts pitch locations and speeds in real time through MLB Advanced Media’s At Bat app. But Fieldf/x can show far more advanced data than any of its predecessors, such as the elevation angle of a batted ball and the highest point in its trajectory, or the distance covered and top speed reached by a player fielding a ball. In order to track these figures, Fieldf/x uses algorithms developed by Sportvision’s in-house data scientists to analyze thousands of terabytes of data, correlating events related to all movements captured by the cameras on the field.

Sponsored

The figures collected don’t simply help settle fan disputes over which player covers more ground as a shortstop; reviewing raw data — as opposed to just video of the plays — can assist baseball clubs in more accurately determining the relative value of different players who play the same position (which is the essence of sabermetrics as displayed in Moneyball). When used by clubs, these data can have an enormous effect on player evaluation.

For example, by comparing the number of strikes called for a catcher in relation to every other catcher in the league, the data can illustrate how good any one catcher is at getting umpires to call strikes. Additionally, general managers and scouts can use the data to show how close pitchers get to their targets. This type of information would be impossible to ascertain by simply watching videos of a game.

Whereas performance data are useful for a sports club — or for an institutional investor — in optimizing performance internally, enabling an organization to place the best players or fund managers in the roles and situations in which they statistically excel, the value of all this analytic power was historically invisible to the outside world. The information Billy Beane collected on players was by definition private. It was his edge, and he would hardly ever dream of sharing it with other teams — let alone making it completely public by sharing it with the fans. But that is precisely what the latest sports technology purports to do: share the most detailed play-by-play analytics with any member of the public who visits NBA.com or MLB.com.

In February 2013 the NBA launched a new stats service on its web site, powered by SAP Hana technology developed by the German enterprise software maker SAP. Hana represents truly big data merged with real-time player analytics and statistical prediction. In deploying it, the NBA has gone a step farther than any other league and created by far the most customer-focused approach to utilizing data collected during games, with its web-based platform called video box scores. Using the Hana database system, which hosts large amounts of video content and processes it in real time, a fan can manipulate the data to display an index of player statistics. After the user has selected which statistics or combination of statistics he wants to view, the index then links to individual videos of each play associated with those statistics. Because Hana stores its massive amounts of aggregate data in live memory, rather than in traditional databases, it’s able to rapidly process more than 4.5 quadrillion combinations of NBA stats and handle up to 20,000 concurrent users.

2013-12-daniel-nadler-nba-stats-article-1.jpg

Imagine investors being able to select exactly what kind of performance metrics and risk-adjusted return behaviors they want to see for a given set of market conditions — as those conditions were unfolding in real time (or as they are anticipated) — and having a system rank from the entire universe of hedge fund managers and portfolio managers exactly which ones most meet those performance characteristics under those conditions. Such technology would make the current system of “everything comes down to one number at the end of the year” seem as archaic, primitive, quaint and charming as watching black-and-white videos of baseball from a single-perspective camera mounted high in the bleachers.

To be sure, the technology is not trivial. Hana stores the data collected during games, which fans can access through a web site, but the process of gathering, matching and processing the video data happens behind the scenes and is daunting. During each game technicians input and funnel statistics to databases housed in an NBA facility in Secaucus, New Jersey. From there, a video-logging system matches the stats to the appropriate portion of the video in which the play occurred, creating an index in the process. This index is then replicated in the Hana database, which stores each play as an individual video. Fans can then query and view each play or a collection of plays by a particular player in a matter of seconds. Because Hana matches queries of the video logs with stats from the game in real time, it can rapidly generate a series of videos that match a user’s request and can be played within a web browser. Fans can filter the statistics by shot type (dunk, three-point field goal, buzzer beater), assists, rebounds and steals, in addition to where on the court the player was located when the play was made.

The NBA’s library of videos in the Hana databases is astoundingly expansive, as any similar system for capital markets would have to be. A New York Knicks fan, for example, can search for and watch a video of every single one of forward Carmelo Anthony’s 669 completed field goals in the 2012–’13 season. Fans can search any statistic, play or player and view hundreds of videos related to their query — oftentimes only an hour after a game has finished. Although the NBA generates revenue from the video box score feature by running ads at the beginning of the videos, the long-term reward lies in maintaining fan interest and engagement with the game.

Does this development suggest the possibility that the kind of internal metrics and data that the best and most quantitatively advanced funds use to track the performance of portfolio managers might some day be made public for institutional investors, and even individuals, to watch and track?

Data such as the historical probability that a given manager will be down in a fourth month if he was down the prior three months in a row (which, like the number of errors thrown by a pitcher when his team is down by a certain margin, might suggest traits related to psychological performance under pressure or response behaviors triggered by spurts of failure) might one day be listed on a transparent central registry or web site for all to see, as surely as one today can look up the percentage of three-pointers that Miami Heat star LeBron James successfully throws in the second half when playing against the Celtics and his team is down by more than ten points.

Few funds today are likely even to track internally such high-resolution information as the examples suggested — not to mention the myriad others made possible by modeling the intersection of the month-by-month returns of every individual portfolio manager and multifactor market conditions. Nevertheless, the data are all there, and they could quickly become public, just as surely as Billy Beane’s private, edge-conferring “new store” of “complicated statistical analysis and equations” is now a few clicks away on the web.

Related