We’ve recently argued that three significant secular trends are likely to hold an outsized impact on the economic trajectory of the U.S. in the years ahead. They are, in no particular order, the major developments taking place in the domestic energy sector (such as, the shale oil and gas boom that has resulted in abundant lower cost resources), a rebounding housing market and the high likelihood of a convergence between consumer and corporate spending patterns (in other words, a modest recovery in corporate capital expenditures).
Despite these positive longer-term factors, however, as 2013’s first quarter ended, we began to see a disappointing turn in the economic data that paralleled the seasonal economic weakness witnessed in recent years. Indeed, since the 2008–’09 financial crisis, we have seen seasonal statistical aberrations each year that raise questions about the actual strength of selected first quarter economic data points.
In the first quarter of 2012, the U.S. economy got a boost from unseasonably mild weather conditions, a good example of idiosyncratic economic seasonality. For instance, average temperatures across the U.S. in January 2012 were 17 percent above the trailing 5-year average to that point, which could have had a wide-ranging positive impact on consumer spending behavior, heating expenses and the ability to perform seasonal outdoor work. Also, there was a marked decline in the number of worker absences due to weather-related factors in the 2011–’12 winter, particularly when compared to the severe conditions of the previous winter or to the ten-year prior average level. And near the end of the first quarter of 2011, the massive earthquake and tsunami in Japan took a toll on confidence and the economy, leading some to posit the possibility of a secondary recession in the U.S.
Post-Financial Crisis Private Payrolls Display Remarkable Seasonality (000s, SA)
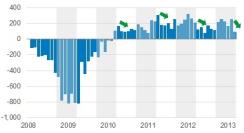
Figure 1
Source: Bureau of Labor Statistics, Bank of America Merrill Lynch |
One very plausible explanation for the economic data seasonality, suggested by colleagues at BlackRock, is the systemic risk fear resulting from events such as the euro zone’s sovereign debt and banking crisis, as well as from troubles in Japan, which have tended to occur during (or near) the middle two quarters of the year. This, in turn, has often led to central bank stimulus around the fourth quarter, which has fed through to improved consumer and business confidence by the first quarter of the following year.
Indeed, a look back at the major central bank liquidity programs appears to support this theory. The Fed’s first round of quantitative easing took place between December 2008 and March 2009; QE2 occurred between November 2010 and June 2011; Operation Twist happened between September 2011 and the end of June 2012; and QE3 began in September 2012. On the other side of the Atlantic, the European Central Bank’s first Long-Term Refinancing Operations took place in December 2011 and its Outright Monetary Transactions program, along with ECB president Mario Draghi’s stated commitment to save the euro, occurred in 2012’s third quarter.

In a sense, then, recognizing that there are lags between policy implementation and economic impact, the seasonally weaker periods of economic data may be thought to resemble the natural level of economic activity under a deleveraging economy, while stronger periods reflect the positive influence of policy stimulus. Moreover, we should note that economic volatility surrounding low core growth levels, as we have seen, allows for singular components of gross domestic product (inventories, in particular) to hold an outsized impact on aggregate growth results.
Where, then, do we stand today in this cycle of economic slowing (or crisis), monetary policy response and subsequent data improvement? In our view, while some form of this data seasonality may persist a while longer, the current economic and policy trajectory in the U.S. is likely to disrupt that dynamic in the years ahead. First, as a result of the previously mentioned secular trends, we think that the U.S. may now be entering a new economic regime that in some ways might resemble the mid-2000s period, or a return to an “older normal,” as it were.
Indeed, household debt levels in the U.S. are moving closer to historic norms, nominal GDP is growing, household net worth has meaningfully recovered from crisis lows and corporate earnings and margins remain solid, even if they slow somewhat. And while recent research out of the Federal Reserve Bank of St. Louis suggests that household sector balance sheet repair has been uneven by demographic category — and has been overstated once inflation and population growth are taken into account — the high-income cohorts that have fared better during the economic recovery are also disproportionately important to consumer spending patterns that feed through to GDP gains.
Moreover, from the standpoint of monetary policy, the Fed’s desire for a continued wealth effect might at this point prove counterproductive, in our view, as it risks excessively distorting markets through asset price inflation, and it hampers true price discovery mechanisms — a risk even the Fed itself has begun to acknowledge. Thus, whether from slowly improving economic growth that exhibits some secular tailwinds or from the limits to monetary policy response effectiveness that we face, 2013 might be the year in which the established pattern of economic seasonality is finally broken.
If this is the case, and discussions of possible Fed tapering of quantitative easing may be a sign, then we are likely to continue to see the high levels of interest rate volatility that are reflective of a market that has heretofore been distorted but is now beginning the process of normalization. We believe investor risk positioning around this dynamic will be vital to performance in the months and years ahead.
Rick Rieder is chief investment officer of fundamental fixed income and co-head of Americas fixed income for BlackRock.