

What can the past tell us about the possible future direction of oil? Analysts and market watchers have spent much of the past year puzzling over the continued decline in the price of oil, but one predictive analytics start-up has developed a tool that, it says, can offer fresh insight into the discussion.
Toronto-based EidoSearch has built what David Kedmey, its co-founder and president, calls a “pattern search engine” able to comb through the price history of all U.S. securities — across equities, fixed income, commodities and currencies — and identify the hidden connections between what is happening to a given asset today and assets that have traded in a similar direction in the past. The search engine uses these pattern matches — the assets whose historical price “shape” matches those of the source asset — as the basis for a current range of projected outcomes for the asset. EidoSearch’s patented pattern search engine is like “Google for numbers,” Kedmey says; the tool has been more than five years in the making, and the commercial version of the software was released late last year.
Applying the technology to the past 12 months of the price behavior of West Texas Intermediate crude oil — and searching exclusively for similar pattern matches through the history of WTI — yields interesting results. The Wall Street consensus that oil, which was recently trading at a six-year low of $42 a barrel, should snap back over the next year from its current slump is vindicated by EidoSearch, which identifies 11 periods in the past in which the 12-month visual price trend in oil was similar to the past year’s. In eight of the 11 analogues, oil went on to rebound in the following 12 months, with an average increase of 31.8 percent; in three of the 11 analogues, oil continued to sell off, with an average drop in price of 16.8 percent. Matches are ranked by the similarity of their visual fit to what’s happening to the present price trend.
Many long-term factors have contributed to the year-long decline in WTI: a global supply glut, driven in part by the boom in domestic U.S. shale oil production and exacerbated by the refusal of Saudi Arabia to cut production; weak demand as European economies remain mired in recession and as growth in the developing world, especially China, moderates; and, to a lesser degree, geopolitical tensions and production disruptions through the Middle East and the Russian periphery.
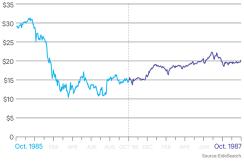
The current pattern bears a strong resemblance to WTI from October 1985 to October 1986, a period that was immediately followed by a sharp rebound. As with today, a global oil glut was in full force in the mid-1980s, but there’s a key difference. Today Saudi Arabia, the leading member of OPEC, is steadfastly refusing to cut production in response to falling prices as it seeks to protect its own position and curtail the growing market share of non-OPEC producers, especially in the U.S. The rationale is that chronically depressed prices will alter the economics of production and force U.S. drillers to shut down or cut back. The Saudis may have other motivations for tolerating low prices for so long — some analysts have pointed, for instance, to a desire on the part of the Saudi royal family to effect regime change in regional rival Iran, with the economic damage brought about by low oil prices a key lever in that effort.

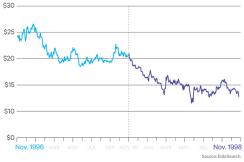
Contrast that with the 1980s. Oil prices had declined from 1982, partly in response to increased supply driven by the growth in non-OPEC producers in the North Sea, Russia and Alaska that had followed the oil crises of the 1970s. To stem the decline, Saudi Arabia attempted to introduce a quota system among OPEC member states that would allow for price stabilization and the maintenance of fixed market shares; part of this involved a gradual cut in production across the board. Initially, other members of OPEC flouted this new system and refused to introduce cuts in line with Saudi Arabia’s demands; as a result, from July 1983 to July 1984, another pattern match with the price trend today, oil declined.
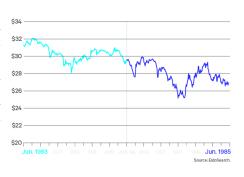
It continued to do so over the following 12 months as OPEC solidarity frayed further. At the end of 1985, with WTI around $25, the Saudis abandoned their role as the “swing producer” in global oil markets and drastically increased production.
The Saudis’ move was calculated and designed to force a price collapse. The bet behind this highly risky strategy was that OPEC’s rogue members would be so hurt by the price decline that they would be compelled to agree to the rigid quota system the Saudis had originally proposed. The bet paid off: WTI collapsed to $10 (March 1986), a new compact was reached among OPEC member states, production was cut, and prices began to rise again. At the same time, U.S. domestic production, which had increased through the early 1980s, began to decline from early 1986, and global growth remained supportive of widespread demand for oil. The rebound seen in the 12 months following October 1986 has to be seen within the context of renewed supply discipline and tightness in the wake of the 1986 price collapse engineered by Saudi Arabia. Similarly, the continued sell-off in the period following July 1984 was a result of poor structural discipline in OPEC and increasing supply from non-OPEC producers.
Is the oil price environment today more like July 1984, after which the sell-off continued, or October 1986, which was followed by a rally? Today the Saudis enjoy much greater authority over OPEC, which is itself a more disciplined cartel, than in the mid-’80s, and their present resistance to cutting production shows little sign of abating. In 1986 the Saudis increased production as a way to force through a general agreement to cut; today the odds of a deviation from their current course of a refusal to cut are low, for now at least, even as 2015 oil production in the U.S. is expected to average a 45-year high of 9.4 million barrels per day. Add to that the prospect of the restrictions on Iranian oil exports ending early next year, and there’s reason to suspect global supply will remain buoyant over the next 12 months, a point of contrast with the period following October 1986. The differences with 1984 are more subtle; if the oil sell-off continues over the next 12 months, it will be for reasons unlike those that drove the post–July 1984 decline.
Oil recovered strongly in the year following July 2009, another 12-month trailing period with a similar price trend pattern to today’s, but this was amid the announcement of extraordinary fiscal and monetary policy measures to combat the onset of the global financial crisis.
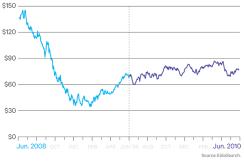
These announcements fed the market’s expectation of a rapid global recovery; today, by contrast, growth expectations are more muted, and the policy bullets at the disposal of the world’s governments and central banks are far fewer in number. The International Monetary Fund expects global GDP growth to improve to 3.5 percent in 2015 and 3.8 percent in 2016, from 3.4 percent last year, with much of the pickup concentrated in the advanced economies. This should provide some support for oil prices, but not on a scale similar to that seen in 2008–’09.
Economic recovery was also a factor in the rallies that followed September 1991 and September 1998.
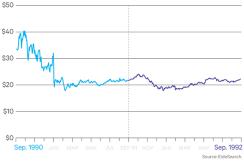
Late 1998 was the flickering end of the Asian financial crisis; in 1991 markets were recovering from the first Iraq war, and the U.S. economy had begun to rebound from a recession produced, in turn, by the Federal Reserve’s post–savings and loans crisis rate tightening and the Gulf War–led oil price shock. These periods may have influenced oil to trade in similar directions to what we see today, but the underlying dynamics were very different.
The factors driving the price of oil have remained constant over the past few decades: growth and growth expectations, OPEC politics, geopolitical conflict, supply and spare-capacity levels. But the particular arrangement of these factors today remains novel, with the Saudis refusing to cut production; U.S. oil production increasing, albeit at a slowing rate; the Iranian nuclear agreement promising an influx of oil into an already oversupplied market; and demand likely to hold steady amid a moderately improved global growth outlook. Technology such as the EidoSearch pattern search engine offers meat to support the consensus expectation of a rally in oil over the next 12 months, while giving us just enough hooks to suggest that this time, things might really be different.