The current economic cycle exhibits some very unusual characteristics that warrant closer examination. Each year since the 2008–’09 financial crisis, we have seen seasonal slowing in economic data sometime around the first quarter, with the back half of the year posting stronger figures. Why that should be so has been something of a conundrum. To be sure, there have often been significant catalysts that could partially explain the phenomenon, such as the massive earthquake and tsunami in Japan in March 2011, which took a toll on confidence and economies, even in the U.S., or this year’s adverse weather effects and labor disputes at West Coast port facilities. Still, there appears to be something larger going on here.
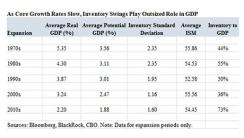
We think one of the keys to solving this puzzle is understanding that the current economic cycle is mean reverting, or shifting back toward the average. This trend is particularly pronounced in production components of the economy that are especially sensitive to inventory swings, which in turn can strongly affect overall growth in gross domestic product (see chart 1). Purchasing managers’ index metrics of economic activity are thus very unreliable as forward growth measures. As to why growth is mean reverting, one possibility is the natural lags between monetary policy implementation and economic impact.
Click to enlarge
Of course, the Achilles’ heel of this economic expansion has been lackluster personal income growth, which has held down consumption and aggregate demand. That now appears to be changing, however. If we were to annualize the past three months of average hourly earnings gains, we would be running at a 3.9 percent rate of growth in wages. We believe that such a trend implies that U.S. economic growth can now become mean reverting around a higher overall level, most likely 2.5 to 3 percent real GDP growth, versus the stubborn 2 percent average growth rate seen earlier in the expansion. In fact, some of our models imply a current growth rate of 2.8 percent, which is in the middle of that likely newer range.
Still, even with a better understanding of the seasonal weakness in data, the question remains: Where are we in the economic cycle today?

Our models indicate that we are in a midcycle expansionary phase in the U.S. in which low interest rates and loose monetary policy continue to support recovery. The seasonal economic slowdown we just experienced is only transitory. Moreover, the consensus probability of a recession for both the U.S. and the euro zone is 10 percent, again suggesting that most believe that the economy is still on a growth trajectory.
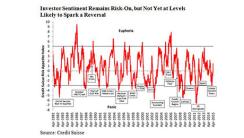
Fascinatingly, when we look at survey reports from institutional investors and money managers, more than 60 percent agree that we’re in the middle of economic recovery. Although concerns over geopolitical risk and monetary policy risk remain elevated, both business cycle risk and credit default risk have waned as worries. The prospect of divergent monetary policy between the U.S. and other developed-market economies is helping drive the U.S. dollar higher, but, by and large, investors are not concerned that the economic cycle is about to turn. That fact is captured in the modestly elevated but not euphoric level of the Credit Suisse Risk Appetite Index (see chart 2).
Click to enlarge
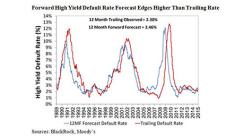
Historically low interest rates, abundant liquidity and loose corporate lending conditions support the credit market at present. Corporations are taking advantage of the issuance environment to raise low-cost capital, and investor demand remains strong for this paper in light of the weakness in government bond yields. Still, there are increasing signs that the high-yield default cycle has bottomed out. In our 12-month forward forecast, we see defaults trending marginally higher than the trailing rate for the first time in three years (see chart 3). Additionally, data from industry survey responses suggest that investors expect high-yield fundamentals to deteriorate over the next year but believe that strong, technically driven demand will overcome this headwind and lead to further spread compression.
Click to enlarge
Although some of our models imply roughly two more years of economic expansion in the U.S., a misstep in monetary policy could alter this forecast. Rising interest rates typically slow an economy and corporate earnings, particularly in the second full year following the initial hike. It is particularly concerning, then, that corporate profits already appear to be decelerating. The economic expansion still appears to be on solid footing, and indeed might even accelerate in the months ahead, but there are signals present suggesting caution is warranted for credit investors, particularly regarding corporate profits, as the Federal Reserve begins the process of rate normalization.
Tom Parker, based in San Francisco, is deputy chief investment officer of model-based fixed income, and Garth Flannery, in London, is a portfolio manager with the model-based fixed-income asset allocation group, both at BlackRock.
See BlackRock’s disclaimer.
Get more on fixed income and on macro.