Vijay Sumon, CME Group
AT A GLANCE
- The Magnificent Seven make up almost 30% of the S&P 500 market capitalization, and accounted for almost 60% of the index’s return in 2023
- Equal Weight Index futures enable investors to trade the market breadth allowing for more diversification and less concentration
The S&P 500 closed above 5,000 for the first time on February 9. This, despite uncertainty over when the Federal Reserve will begin cutting interest rates, which are at their highest level in more than two decades even though U.S. inflation is down sharply from its peak.
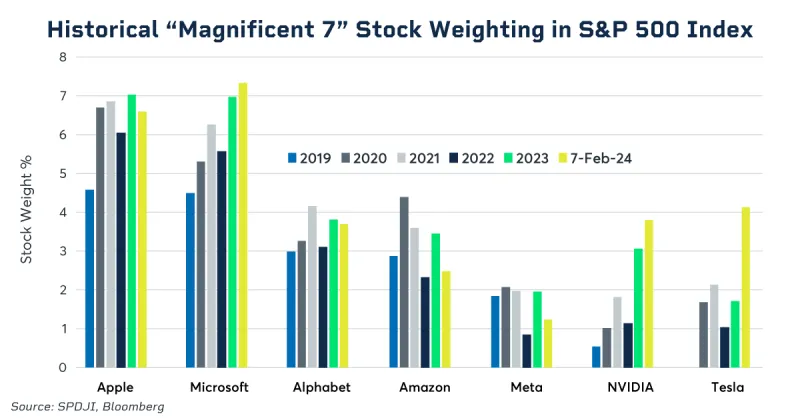
Much of the rally in equities can be attributed to the performance of a handful of mega-cap stocks that have come to be dubbed the “Magnificent Seven.” These stocks, making up almost 30% of the S&P 500 market capitalization, accounted for almost 60% of the index’s return in 2023.
Equal Weighting is Less Crowded
The heavy concentration of these seven companies in equity indices raises the question of whether investors should diversify their portfolios as a means to distribute risk. One way to manage that risk could be to de-allocate from the largest stocks and rebalance away from recently outperforming companies.

Seven Mega Cap Stocks Have Largely Been Driving the U.S. Stock Market
The surge in equities is coming at a time when the yield curve is the most inverted in 40 years. Yield curve inversions in 1979, 1981, 1989, 1990-2000 and 2006-2007 preceded recessions. The U.S. economy, however, has been growing at a robust clip, underpinned by consumer spending amid solid wage growth, and there are expectations for a soft landing without any severe contraction or a recession.
Reducing Concentration of Large Caps
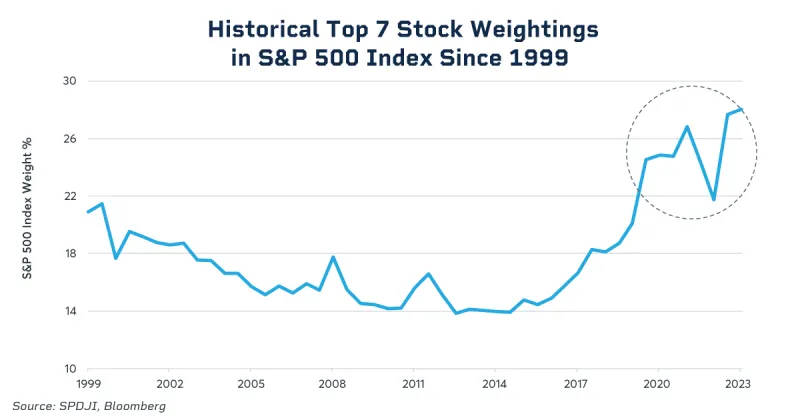
History suggests that there is a relationship between concentration and the relative performance of equal weighting: after peaks in S&P 500 market-cap concentration, the S&P 500 Equal Weight Index tended to outperform, according to research from S&P Dow Jones Indices.
Equal Weight Index futures enable investors to trade the market breadth – more diversification, less concentration and as an alternative expression of the S&P 500 Index – in taking risk exposure or hedging exposure. The S&P 500 Equal Weight Equity Index is a more diversified version of the U.S. large market cap stocks as represented by the S&P 500 Index. The ability to avoid concentration in the largest stocks and the discipline of regular rebalancing are sometimes ascribed exclusively to active management. Both are encoded in the S&P 500 Equal Weight Index.
While the weight of the largest 50 names within the S&P 500 represent 55% of the index, the largest seven stocks recently reached as high as 30% of the index weight, a historically high number over the last 30 years.
Equal Weighting Approach
Equal weight indices typically display other characteristics that distinguish their performance from capitalization weighted benchmarks, the most obvious of which is a greater participation in the performance of smaller companies.
If larger stocks outperform smaller ones, concentration will increase, and equal weight will underperform. Similarly, if smaller stocks outperform, concentration will decrease, and equal weight will outperform.
Changes in market concentration levels have a natural impact on the performance of an equal-weight index. As the largest stocks outperform, the market becomes more concentrated in those names and all else being equal, the market cap-weighted indices will outperform equal weight indices.
Furthermore, in a low-correlation environment, an equal weight index may also offer an effective way to:
- Benefit from the diversification return via a regular re-balancing schedule
- Potentially benefit from a “reversion to the mean” in equity market concentration and valuations.
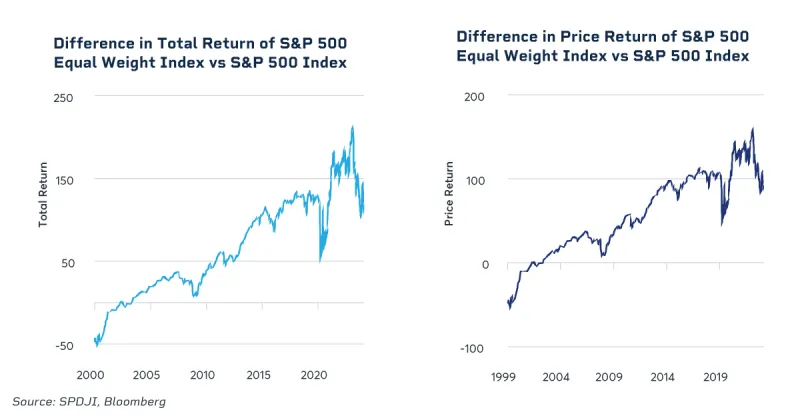
The index’s performance since launch in 2003 has been interesting. Its total return is not only higher than its large-cap benchmark index, but also higher than S&P and Dow Jones Index’s benchmarks for the Mid- and Small-cap U.S. equities. Similarly, the price return for S&P 500 Equal Weight Index has also out-performed its large cap benchmark index, the S&P 500 Index.
The difference in performance between the S&P 500 Equal Weight Index and the S&P 500 Index is frequently material, which means that it may have a potential explanatory power for the relative performance of other large-cap U.S. equity portfolios or indices. Size exposure alone explains a considerable portion of the S&P 500 Equal Weight Index’s long-term returns.
Overview of Index Performance
- The S&P 500 Equal Weight Index underperformed the S&P 500 by 12% in 2023.
- In January 2024, the underperformance continued by a further decline of 3%.
- Nine out of 11 equal weight sectors underperformed their cap weighted counterparts.
- Technology was the top performer over the past 12 months for equal weighted and cap weighted.
Index composition for the S&P 500 Equal Weight Index is the same as that of the S&P 500 Index. Each company is equally weighted as of the respective rebalance reference date, rather than weighted by float-adjusted market capitalization. The largest single constituent company signifies 0.28% of the Index’s weight. The largest 10 constituents represent 2.457% of the Index’s weight.
This creates a natural diversification for investors, and in the futures market, offers more ways to hedge against the quickly rising (or falling) nature of the Magnificent Seven and their ability to influence overall index performance.