Jim Iuorio, for CME Group
AT A GLANCE
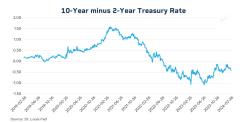
- This current yield curve inversion has turned out to be the longest and deepest inversion in 50 years, lasting 18 months and several times hitting negative 100 basis points.
- Micro yield contracts are quoted in yield terms, which removes a good deal of the bond math that was needed to convert price to rate.
In 2022, the Federal Reserve unleashed one of the most aggressive hiking cycles in history. It began modestly with a simple 25 basis point hike in March 2022 but accelerated quickly with 400 basis points of hiking over the next six meetings and a total of 525 basis points by July 2023.
Of course, the Fed's actions were in response to runaway inflation that turned out to be not as “transitory” as the Federal Reserve had hoped. In May 2021, U.S. CPI printed 5% which began a string of 23 straight months with year-over-year inflation above 5%, including a high of 9.1% in June 2022. By June 2023, inflation had fallen to 3% and it appeared to be in full retreat. Unfortunately, the last mile of the journey has been more difficult than anticipated, as the last eight months have shown readings in the mid 3% area, well above the Fed’s stated target of 2%.
In response to the rapidity of the short-end rate hikes, the U.S. yield curve inverted, with 2-year Treasury yields going above 10-year yields for the first time since 2006. This inversion has turned out to be the longest and deepest inversion in 50 years, lasting 18 months and several times hitting negative 100 basis points.
Historically, this unusual shape of the curve is a precursor to a recession. The most simple explanation is that the market is predicting that interest rates, in the future, will have to be lowered to address economic weakness. Erik Norland, Chief Economist at CME Group, noted that “at the long-end of the curve, the 10-year yield tends to reflect future inflation expectations, which appear to be contained.” Although this recession indicator is not perfect, its track record is good, having correctly forecasted five out of the last six recessions dating back to the 1970s.
When are Rate Cuts Coming?
Now, questions have arisen regarding the coming path of inflation balanced against Fed expectations for interest rate eases. Norland recently pointed out the positive outlook saying “all around the world, inflation rates are receding quite rapidly and across all major economies, with inflation being slower in the second half of 2023 than it was in the first half.” And that “markets in the U.S., Europe, Canada, Australia and the United Kingdom are all projecting that the most likely outcome is rate cuts but the question is when?”
The U.S. futures markets have also had a difficult time predicting when interest rate eases may come. Just within the last two months, the Fed Funds curve has priced in the probability of almost 170 basis points of eases in 2024, but more recently a majority of traders are pricing in a 75-100 basis points cut this year, according to the CME Fedwatch Tool.
In March 2023, in response to regional bank stress, the Fed opened a facility to buy distressed assets from the banks, which was essentially a restart of quantitative easing and balance sheet expansion. This action has led some analysts to believe that the Fed may not possess the steely resolve that they publicly portray. Historically, the path from a hiking cycle to an easing cycle can be treacherous. Providing historical context, Norland notes that “often what happens is the central banks resist cutting for a period of time. Then they start cutting slowly. Then they cut a whole bunch, in response to economic stress.”
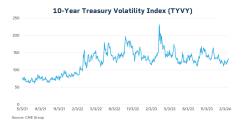
Hedging Around Economic Releases
Going forward the market will be hyper-focused on U.S. economic data to assess Fed policy in 2024. In the coming weeks, market participants will get a view on the latest employment situation and a read on the U.S. CPI. For both institutional and retail traders looking to hedge interest rate risk or express directional opinions on rates, CME Group’s span of interest rate products also includes micro yield contracts.

These new contracts are quoted in yield terms, which removes a good deal of the bond math that was needed to convert price to rate. The yield contracts also eliminate the need to ratio contracts to trade the direction of the yield curve. For example, when using the traditional CME Group interest rates contracts, it was necessary to do a greater amount of 2-year contracts vs 10-year, due to the different sizes of the contracts and the increased volatility in the 10-year. Usually that ratio was around (1.7) 2-year to every (1) 10-year. If you didn’t execute the ratios properly you would have an unwanted directional element to the trade. The yield contracts have plugged that hole and eliminated the calculation.
The potential outcomes for rates are many – the Fed could cut rates in May, inflation could remain stubbornly high for months, this lengthy yield curve inversion era could continue throughout 2024. Or none of those things could happen, which makes keeping a close eye on interest rate markets so important for traders.