Contributors
Andrew Innes, Head of EMEA, Global Research & DesignRupert Watts, Senior Director, Strategy Indices
Jingwen Shi, Senior Analyst, Global Research & Design
Executive Summary
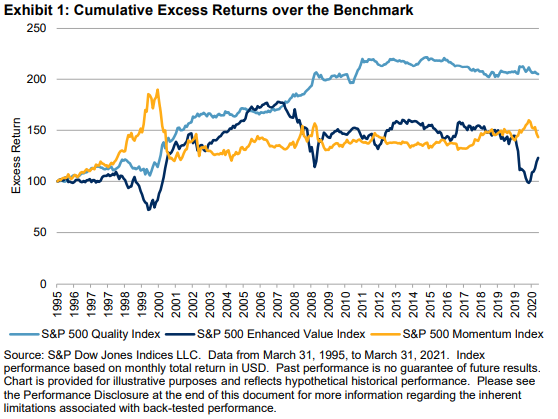
Factors that outperform over time are also prone to extended periods of underperformance, which are difficult to time. For investors seeking exposure to factor risk premia but with greater diversification and reduced cyclicality, multi-factor strategies may be more suitable than single factors.Accordingly, S&P DJI presents a new series of multi-factor indices, collectively known as the S&P QVM Top 90% Indices, covering the U.S. large-cap, mid-cap, and small-cap universes (S&P 500®, S&P MidCap 400®, and S&P SmallCap 600®, respectively). In this paper, we analyze the indices' methodology and performance characteristics. Multi-factor scores are based on the average of three separate factors: quality, value, and momentum (QVM). This new index series encompasses a high proportion of the universe, whereas existing multi-factor indices are typically more concentrated.
Different multi-factor strategies produce different outcomes and positioning. Construction matters. These new indices select constituents in the top 90% of the universe, ranked by their multi-factor score and weighted by float-adjusted market capitalization (subject to constraints).
The indices generated moderate outperformance by removing the lowest-ranked decile of stocks. This plus float-adjusted market cap weighting allows the indices to retain many of the core features of the benchmark. In summary, the key historical performance characteristics of the S&P QVM Top 90% Indices include:
- Moderate outperformance versus the benchmark;
- Low tracking error;
- Low turnover;
- Low active share; and
- Sector weights consistent with the benchmark.
Introduction
With the rising adoption of factor indices, the traditional boundaries between passive and active investing have become increasingly blurred. For decades, institutional investors constructed portfolios from a combination of market-cap-weighted index funds and active funds. Now, factor-based investing straddles these two approaches and enables institutional and retail investors alike to implement active strategies through passive vehicles.Single-factor equity strategies (quality, value, or momentum) have been widely adopted to harvest each factor risk premium that could reward market participants over the long term. However, each factor is susceptible to periods of underperformance dependent on the market environment and economic cycle. This induces some market participants to attempt the notoriously difficult task of timing factors through tactical allocation strategies.

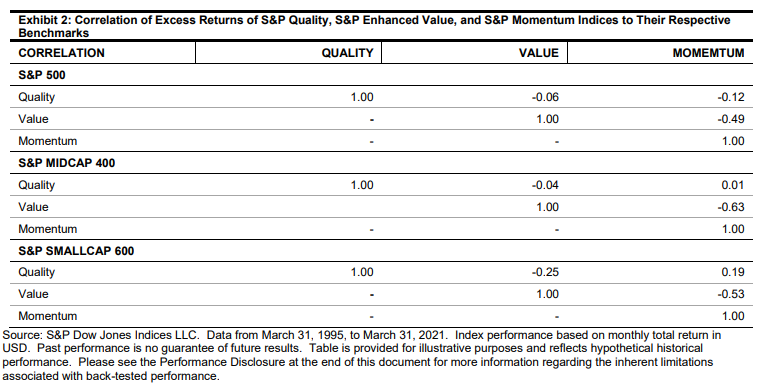
An alternative solution is to employ a transparent multi-factor strategy that aims to capture exposures across all targeted factors simultaneously. Such a strategy exploits the potential diversification benefits by combining factor returns that have relatively low correlation to one another (see Exhibit 2). Subsequently, the diversified factor exposures may provide more stable excess returns over shorter time horizons, while still capturing their average long-term risk premia. Importantly, this approach avoids the need to subjectively time factor exposures.

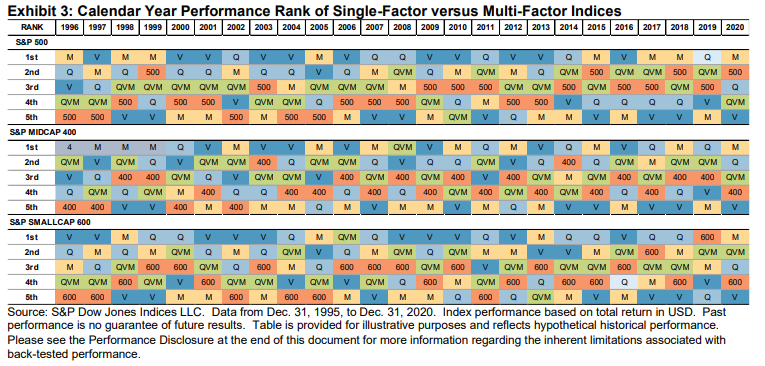
Exhibit 3 demonstrates the key differences between single-factor strategies and the multi-factor strategy in these indices. Here the full-year return of three single factor indices (S&P Quality, S&P Enhanced Value, and S&P Momentum), the S&P QVM Top 90% Multi-factor Index, and their respective benchmarks are ranked each year. Across all three universes (S&P 500, S&P MidCap 400, and S&P SmallCap 600), the wide variability in the calendar year performance rank of each single-factor strategy is evident. Conversely, the multi-factor strategy more consistently exhibits stable excess returns (higher performance rank) across most calendar years with respect to its benchmark.


