Following the crowd can be dangerous. And literally so today. But crowd psychology can be used to an investor’s advantage.
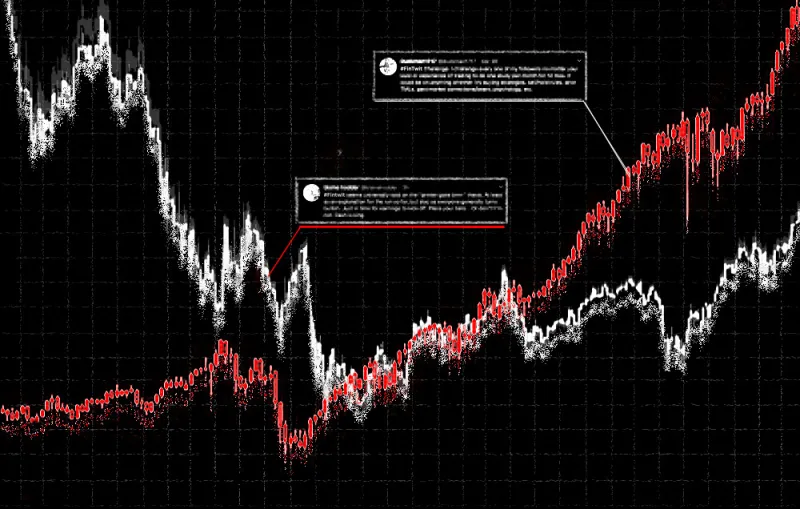
Stocks hit a record high on Feb. 19 just before the new coronavirus sent investors fleeing. On March 12, with the S&P 500 down 27% in weeks, StockTwits co-founder Howard Lindzon, wrote in a blog post “we might be at some sort of panic and selling exhaustion.” That day, scores of blue chip stocks had fallen to a 52-week low, including Facebook, Walt Disney, and Johnson & Johnson.
Lindzon argued that investor sentiment on StockTwits, as expressed by the ratio of bullish to bearish posts, had “reached an extreme I have never seen” for his “social VIX reading.” He notes that the ratio “has averaged between 4–7 for years and years” and sunk to 2.5 when he wrote his post.
Lindzon tells RIA Intel that today the sentiment ratio is “back to 4-5 times bullish to bearish messaging,” which suggests stocks may still be undervalued despite the recent rally. StockTwits, which pioneered the practice of organizing conversations with “cashtags” ($TSLA), bills itself as “the largest social network for investors and traders.”
Lindzon’s assessment wasn’t far off the mark as stocks bottomed on March 23. By then, the S&P was down a third from its peak.
A 32-page academic paper published last week took a deep dive into posts on StockTwits during the pandemic to explore “investor beliefs, sentiment and disagreement.”
In “Inside the Mind of Investors During the COVID-19 Pandemic: Evidence from the StockTwits Data,” Hasan Fallahgoul, Senior Lecturer of Quantitative Finance at the School of Mathematics at Monash University in Victoria, Australia, analyzed nearly 3.7 million messages posted to the platform between Nov. 30, 2019, and March 31, 2020.
Fallahgoul found that “the disagreement” between bulls and bears reached an extreme level on March 23, the day the market bottomed. This dovetails with Lindzon’s March 12 observation. Fallahgoul adds that sentiment demonstrated “a sharp reverse” after March 23rd when stocks began rising.
“If I want to invest based on the relationship between the disagreement and price process on March 23rd, I would take long positions in stocks that just had the highest disagreement,” Fallahgoul tells RIA Intel. “The same strategies can be taken for the disagreement processes among sectors. This time by taking a short/long position in ETFs related to that sector if the disagreement is low/high.”
Fallahgoul says the pattern of sentiment and disagreement was homogeneous for investors across and within investment philosophy, horizons, and experiences. However, he notes that the pattern is “heterogeneous across sectors,” adding that during the pandemic, investors have been most pessimistic about the financial sector and most optimistic about healthcare.
The report indicates that technical investing is most common on StockTwits, followed by growth and momentum, fundamental, and value strategies. Global macro investors were least represented.
Per time horizon, swing traders comprise the biggest bloc, followed by long-term investors, day traders, and position traders, respectively. Investors with intermediate experience are most common, followed by novice and professional users.
The study indicates that professional investors are more pessimistic, and post more often, than novice and intermediate investors.


