Greg Spilker, CME Group
AT A GLANCE
- Even after a sell-off in November, gold prices remained high from earlier in the year due in part to a weaker U.S. dollar
- The gold-copper ratio has been steadily increasing since 2018, signaling that the world economy remains in risky territory
The December 2020 delivery contract reached a price of $2,069 on August 6, before the market came back down, and in late November dropped below $1,800 for the first time since July. The price action this year has captured many traders’ attention. Let’s take a look at some of the developments in the gold market.
Dollar Weakness and Inflationary Bias
Gold strength often means dollar weakness, and vice-versa. Because of the unprecedented fiscal and monetary responses to the COVID-19 crisis, the U.S. dollar has recently fallen out of favor as the risk of inflation has weighed on some investors. This has weakened the status of the U.S. dollar as the global reserve currency. Gold has been strengthening versus the dollar, but so has the Euro, the Yen and the Swiss Franc, which have all increased versus the greenback year to date. Even without gold-specific factors coming into play, the precious metal is often expected to gain value when the dollar’s main challengers are strengthening.
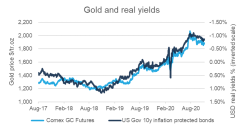
The same factors also may show themselves in a low-yield environment for dollar-denominated assets. Bond buying by the Federal Reserve and others has effectively put a cap on nominal yields. With higher inflation expectations, this translates into record low real yields. The negative correlation between inflation-adjusted yields and gold prices has been well documented in the past and continues to hold true.

Market Positioning
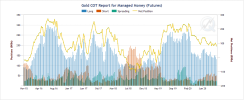
Net positioning by managed money – the category that would include hedge funds, commodity trading advisors etc. – currently shows a bullish bias. Net long positions are currently at around 100,000 contracts. This is on the high side by historical standards, but certainly not at extreme levels. In fact, net long positions are below where they were at the beginning of 2020, when gold was trading at $1,600.
At the same time, open interest in COMEX GC futures is now on the rise. It started the year at record high levels of 800,000 open contracts and decreased to below 500,000 at its trough in early June. As of mid-November, it was back to about 550,000 contracts – someway below the record high, but a number that is in line with the past few years.
Gold's Relative Value
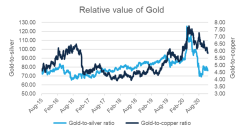
Gold is a widely accepted yardstick and it is useful to measure its price as a ratio to other commodity assets. The gold-to-copper ratio for instance can indicate the relative health of the world economy. Unlike gold, copper is widely used in industry and generally serves as a bellwether for economic activity.
The gold-to-copper ratio has been steadily increasing since early 2018.Its rise overlaps with the onset of the U.S.-China trade conflict. The gold-to-copper ratio has now decreased from record high levels, but it remains elevated. A high ratio signals that the world economy remains in risky territory. In this environment, it is no surprise that gold continues to be sought after for its safe-haven appeal.
To a lesser extent, the gold-to-silver ratio plays a similar role. Silver has industrial applications, notably in photovoltaics. This ratio reached an all-time high level of above 120x back in March – this increase was mostly due to silver selling off aggressively when Covid-19 forced global lockdowns. Starting in the second quarter, however, silver continuously outperformed gold and thereby pushed the ratio back to levels of around 70, below where it started the year. Unlike gold, silver is still a long way off its record highs.
There are many potential reasons why gold has found strong buying interest in 2020. The global economic outlook is highly uncertain. Governments and central banks have been dealing with an unprecedented crisis and have resorted to drastic measures in response.
While gold has shone brightly this year as the investment community has valued its safe-haven appeal, there remains a lot of uncertainty in the marketplace ahead. Open interest and net positioning by market participants shows healthy participation in GC futures trading. With high liquidity through the trading day, GC futures remain the prime contract for global gold trading.