General partners (GPs) have historically managed the capitalization of their firms and/or unlocked value using more traditional sources of financing such as bank debt, going public or outright equity stake sales. And yet, the evolving and growing private market environment – marked by growing demand for private market solutions alongside constrained liquidity markets and shorter fundraising cycles – has driven demand for more nuanced, flexible solutions. As a result, structured GP Financing Solutions have emerged as an innovative tool that can provide flexible solutions to GPs while preserving long-term alignment with GPs’ most important partners… their limited partners (LPs).
A Brief History of Private Equity and GP Stakes
The Rise of Private Equity
While initial private equity (PE) transactions took place as early as the mid-20th century, the prominence of the asset class grew significantly in the 1980s, when leveraged buyout transactions gained more attention as financiers recognized a potential opportunity to strategically employ leverage to finance deals and generate compelling risk-adjusted returns on private assets.
We first saw this with early pioneers who demonstrated the potential power of private ownership and investment. They grew from entrepreneurial investment boutiques to global asset managers managing billions of long-term capital.
Since then, what once was a niche asset class has evolved into a key allocation of many institutional portfolios. More recently, PE has also become a growing component of many individual investors’ portfolios. PE as an asset class has become a pillar of the financial services industry and with it, we’ve seen an evolution in how GPs themselves have financed their management companies and unlocked embedded value and sought continued alignment with their investors.

The Advent of Going Public
In the early 2000s, as private markets matured, certain asset managers increasingly became operating companies in their own right. Many GPs recognized the need to access permanent capital to support long-term growth, strengthen financial stability and enable liquidity for founding partners, leading to several firms pursuing public listings.
Blackstone's 2007 initial public offering (IPO) was a seminal moment. Then came IPOs by KKR, Apollo, Carlyle, Ares and others. These offerings raised substantial capital and crystallized wealth for founders and shareholders alike, demonstrating not only PE’s success at managing capital but also the inherent potential value in the management companies themselves.
However, the transition to public markets brought its own considerations: potential for additional focus around GP-LP alignment, greater regulatory oversight, pressure for quarterly earnings performance and an expensive (albeit permanent) source of capital for GPs that opted to go public. So, while some firms have chosen to balance the pros and cons of being public, others have opted to stay private. Neither is better or worse – each comes with its own nuances.
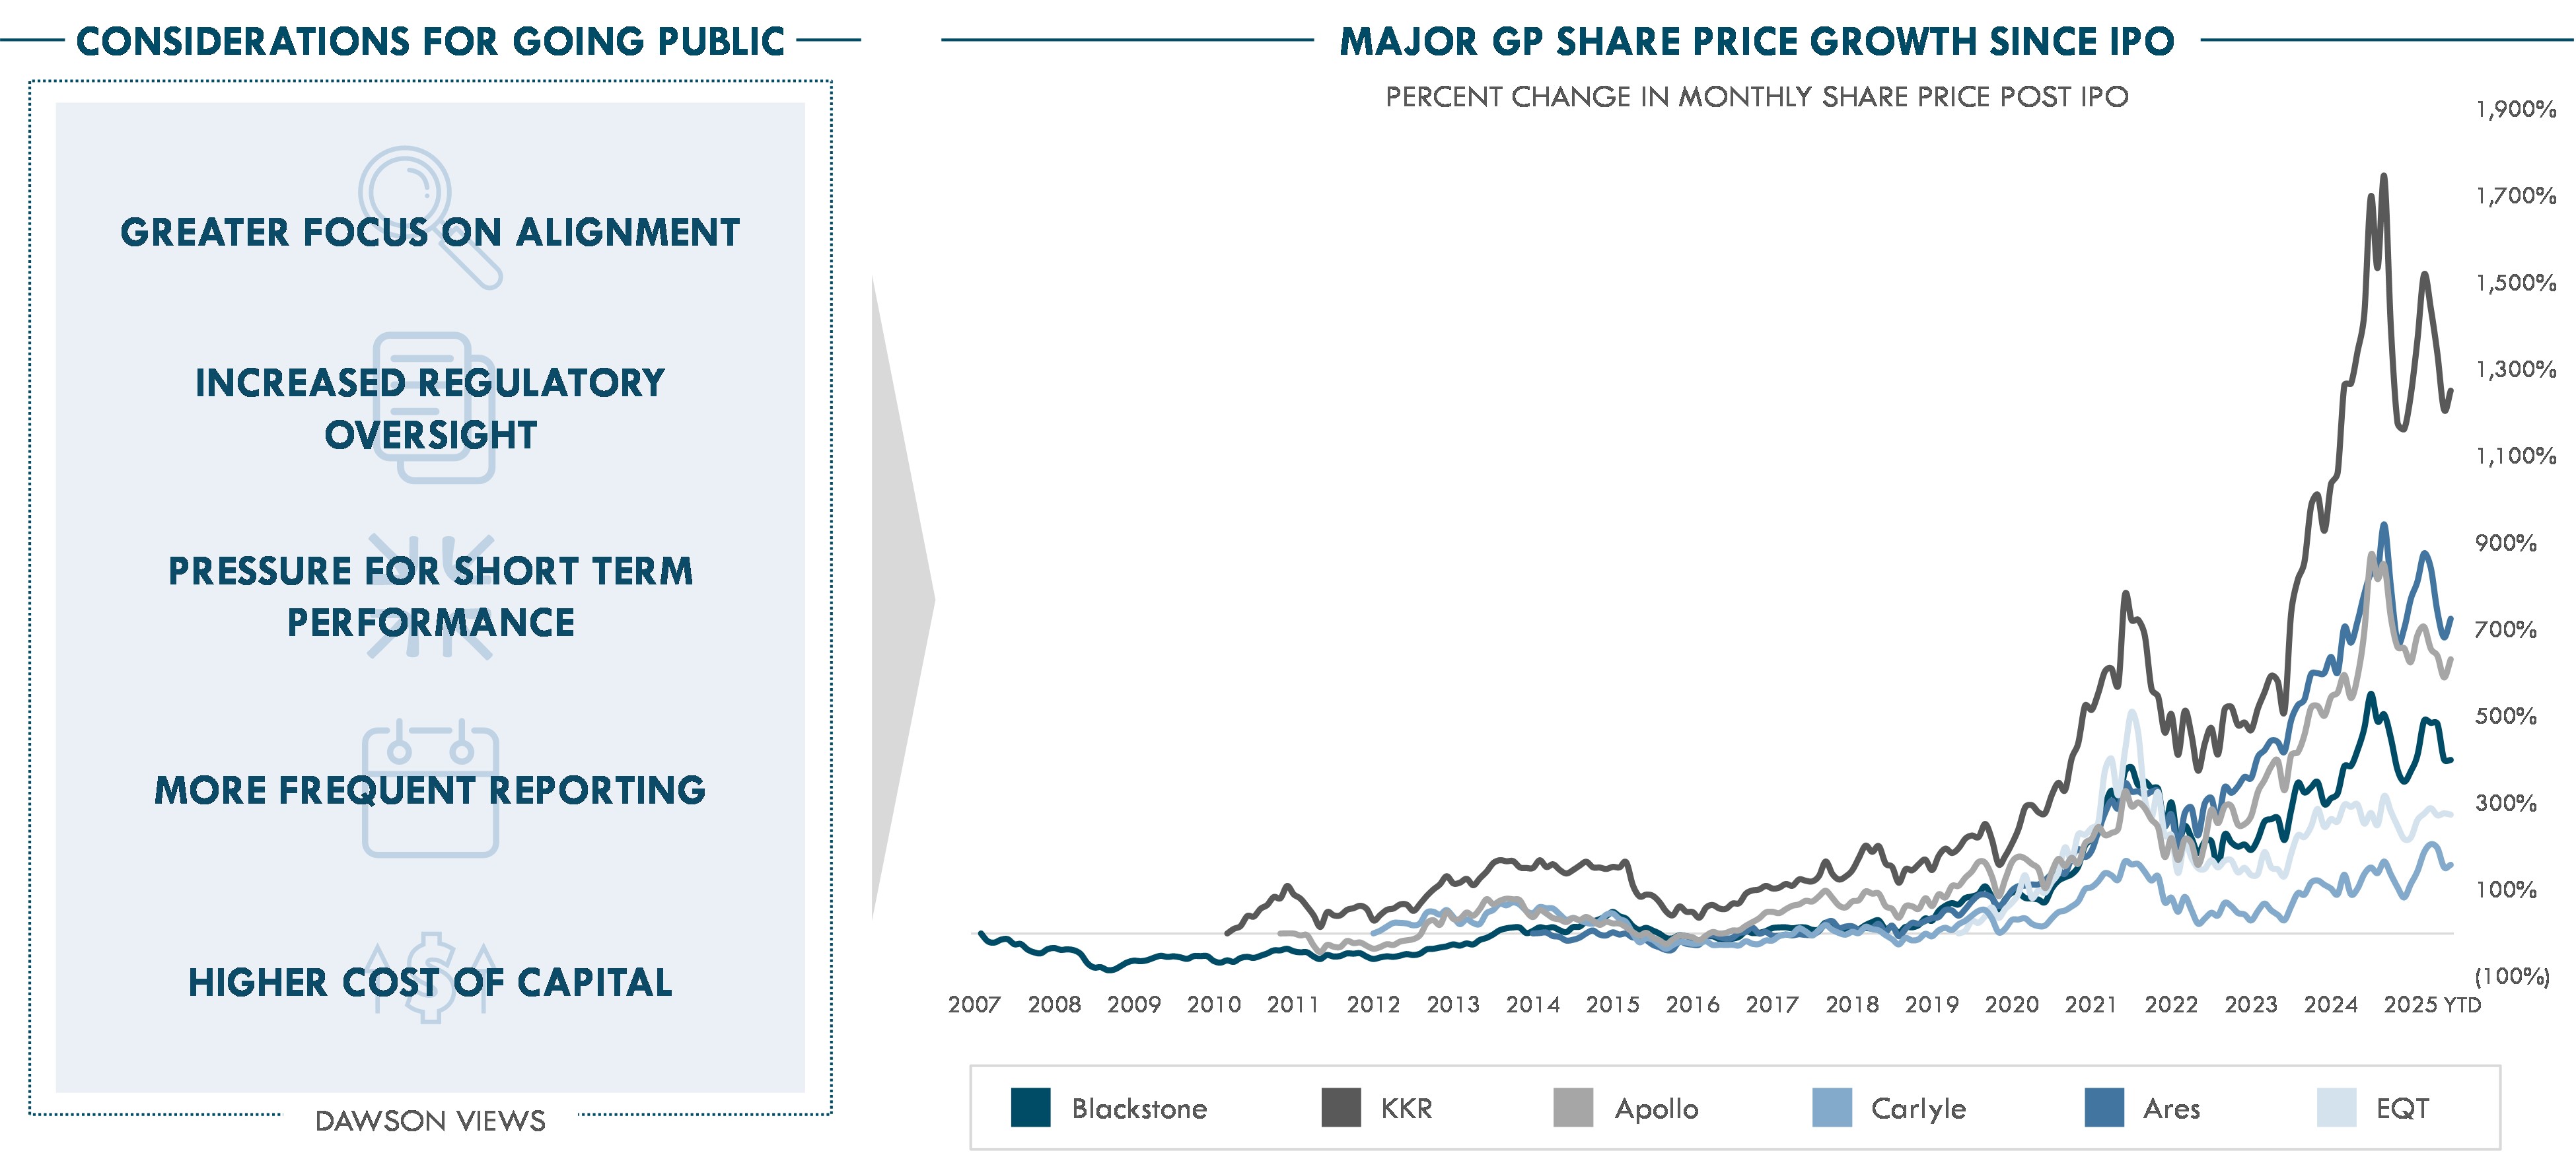
CHART 1.0
Source: S&P Capital IQ Pro. Refer to Legal Disclaimers below for more details.
Emergence of GP Stake Sales
As the market continued to evolve, GPs sought new forms of capital to finance their businesses. Traditional bank financing remained a viable alternative but came with customary constraints inherent to this form of financing – restrictive covenants, cash-pay interest payments, fixed maturities, and modest loan-to-value (LTV) limits – some of which failed to provide the growth capital or flexibility GPs required.
And so, the market responded and an alternative form of financing emerged with the introduction of GP stake sales, whereby dedicated investment platforms began acquiring minority interests in management companies. GP stake investors offer sponsors capital to crystalize wealth, re-invest into the business or manage succession, all without the loss of control. However, GP stake sales raise many similar issues to public offerings, as these transactions come at a permanent cost in the form of the sale of equity in the business. And as these stakes were sold, questions arose around long-term alignment between GPs and their investors and what this meant for succession planning.
The Case for A Structured Solution
Strategic Intent Meets Structural Gaps
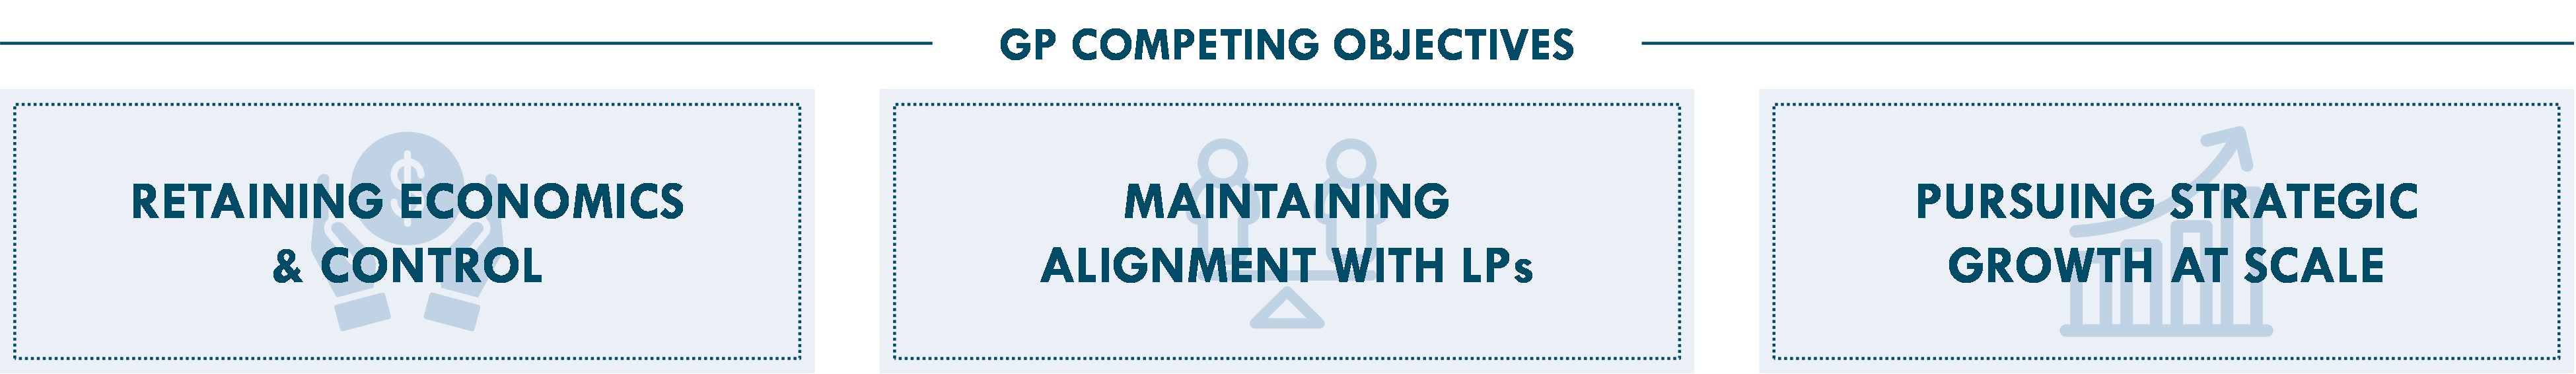
Once again, the market responded. As many GPs faced competing objectives: (i) retaining long-term economics and control; (ii) maintaining alignment with LPs; and (iii) pursuing strategic growth and accessing the capital needed to scale – the need for a more flexible, innovative and structured form of financing emerged.
Today, at Dawson, we see a large and growing opportunity for what we call “GP Financing Solutions” – bespoke financing structures sitting between an outright equity sale and traditional bank borrowing, helping bridge the gap between flexibility and permanence. This solution is not meant to replace other offerings available, but rather to add a new tool in a GP’s toolset to consider as they manage the capital requirements of their firms.
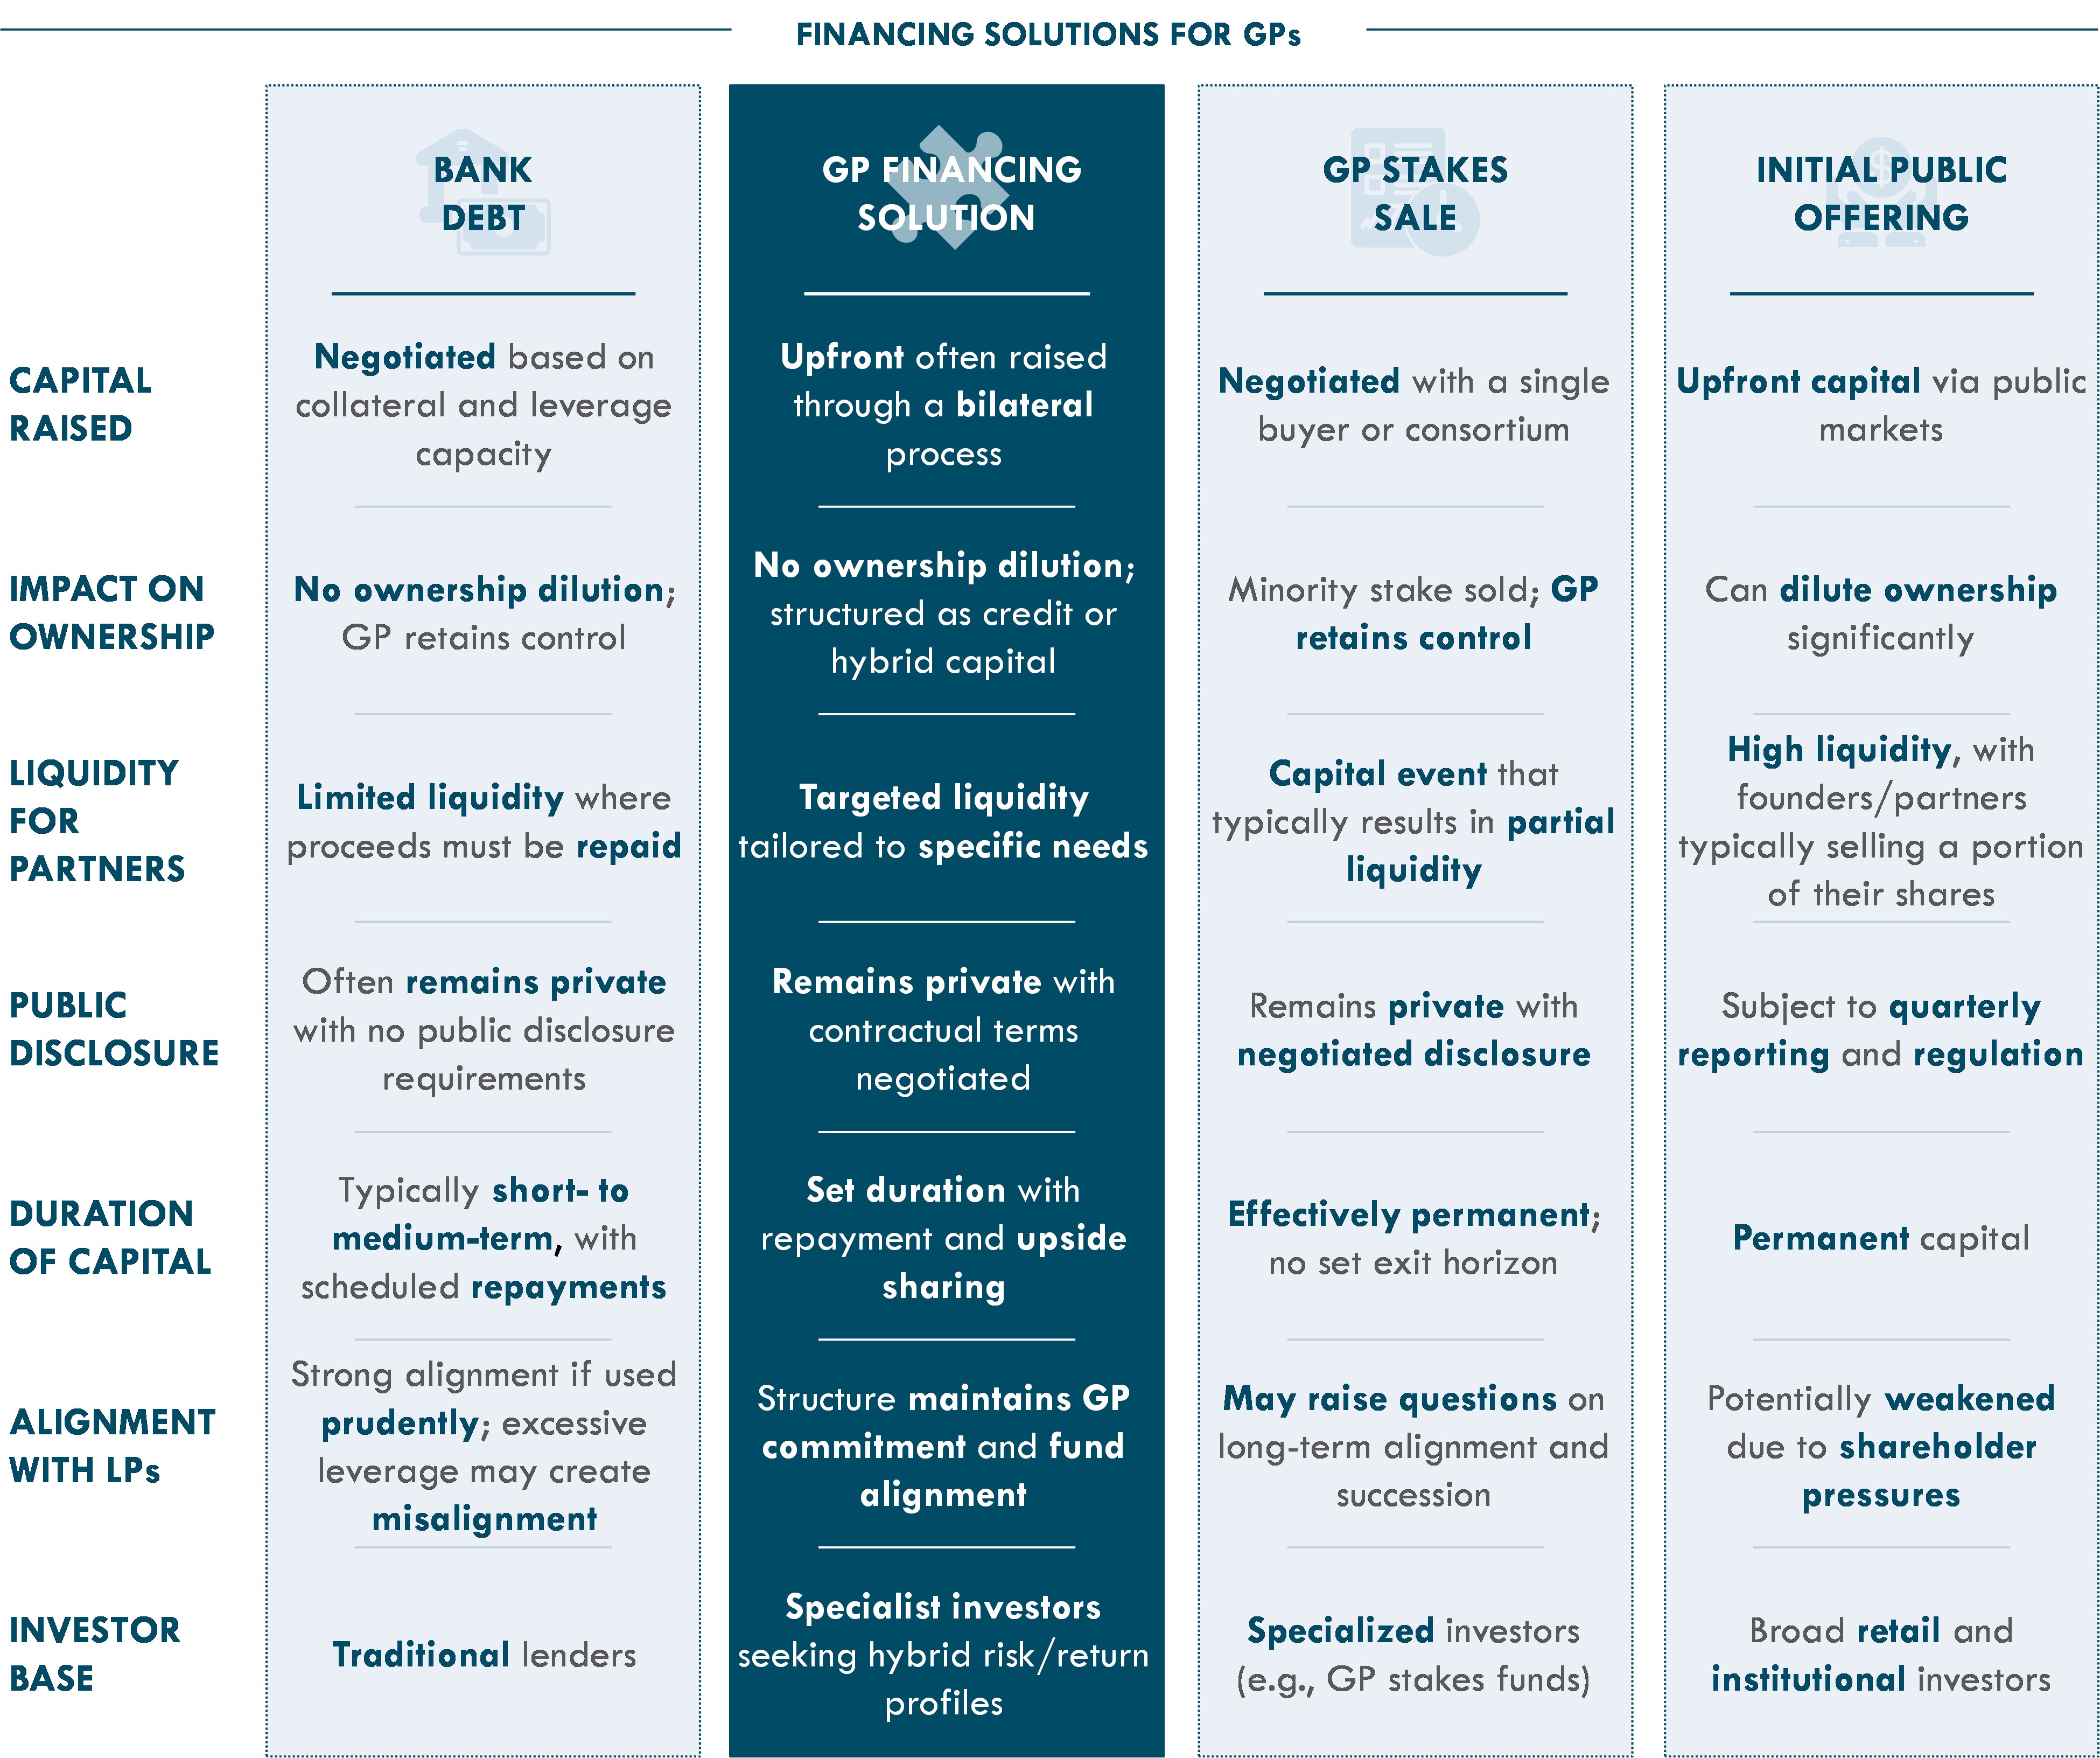
CHART 2.0
Refer to Legal Disclaimers below for more details.
The Challenge Facing Many GPs Today
Today’s lower liquidity environment has been challenging for many GPs. Based on the over 150 GPs we monitor, we estimate there are over 50 GPs that will return to market in the next 18-24 months seeking to raise in aggregate over $700 billion in capital – coming back faster and larger.1
And as the funds managed by GPs continue to grow in size, the capital demands on GPs haven’t diminished – if anything, they’ve grown. From succession planning, re-investing in their management companies and seeking to demonstrate alignment with LPs through meaningful GP commitments, the need for capital remains acute.
But finding liquidity to manage this has become increasingly challenging.
In recent years, distributions in PE have been anemic. In fact, over the past three years, average distributions from PE are at historic lows. The effect of this low liquidity environment has been further compounded by a general retrenchment from traditional lenders that we are seeing.2
Looking back at the last 25 years of PE performance, we can see that on average, PE distributes 0.26x of distributions relative to carrying value annually. There are only three periods in which this ratio fell below 0.2x – the dot com bubble, the global financial crisis and today.
And yet, today’s environment appears to be different. For the first time in history, annual PE distributions are expected to remain below 0.2x for three consecutive years. In fact, according to McKinsey & Company, a record 61% of buyout-backed companies have now been held longer than four years, creating the largest exit backlog in two decades.3
Safe to say, GPs and LPs alike have struggled to realize meaningful liquidity during this period.
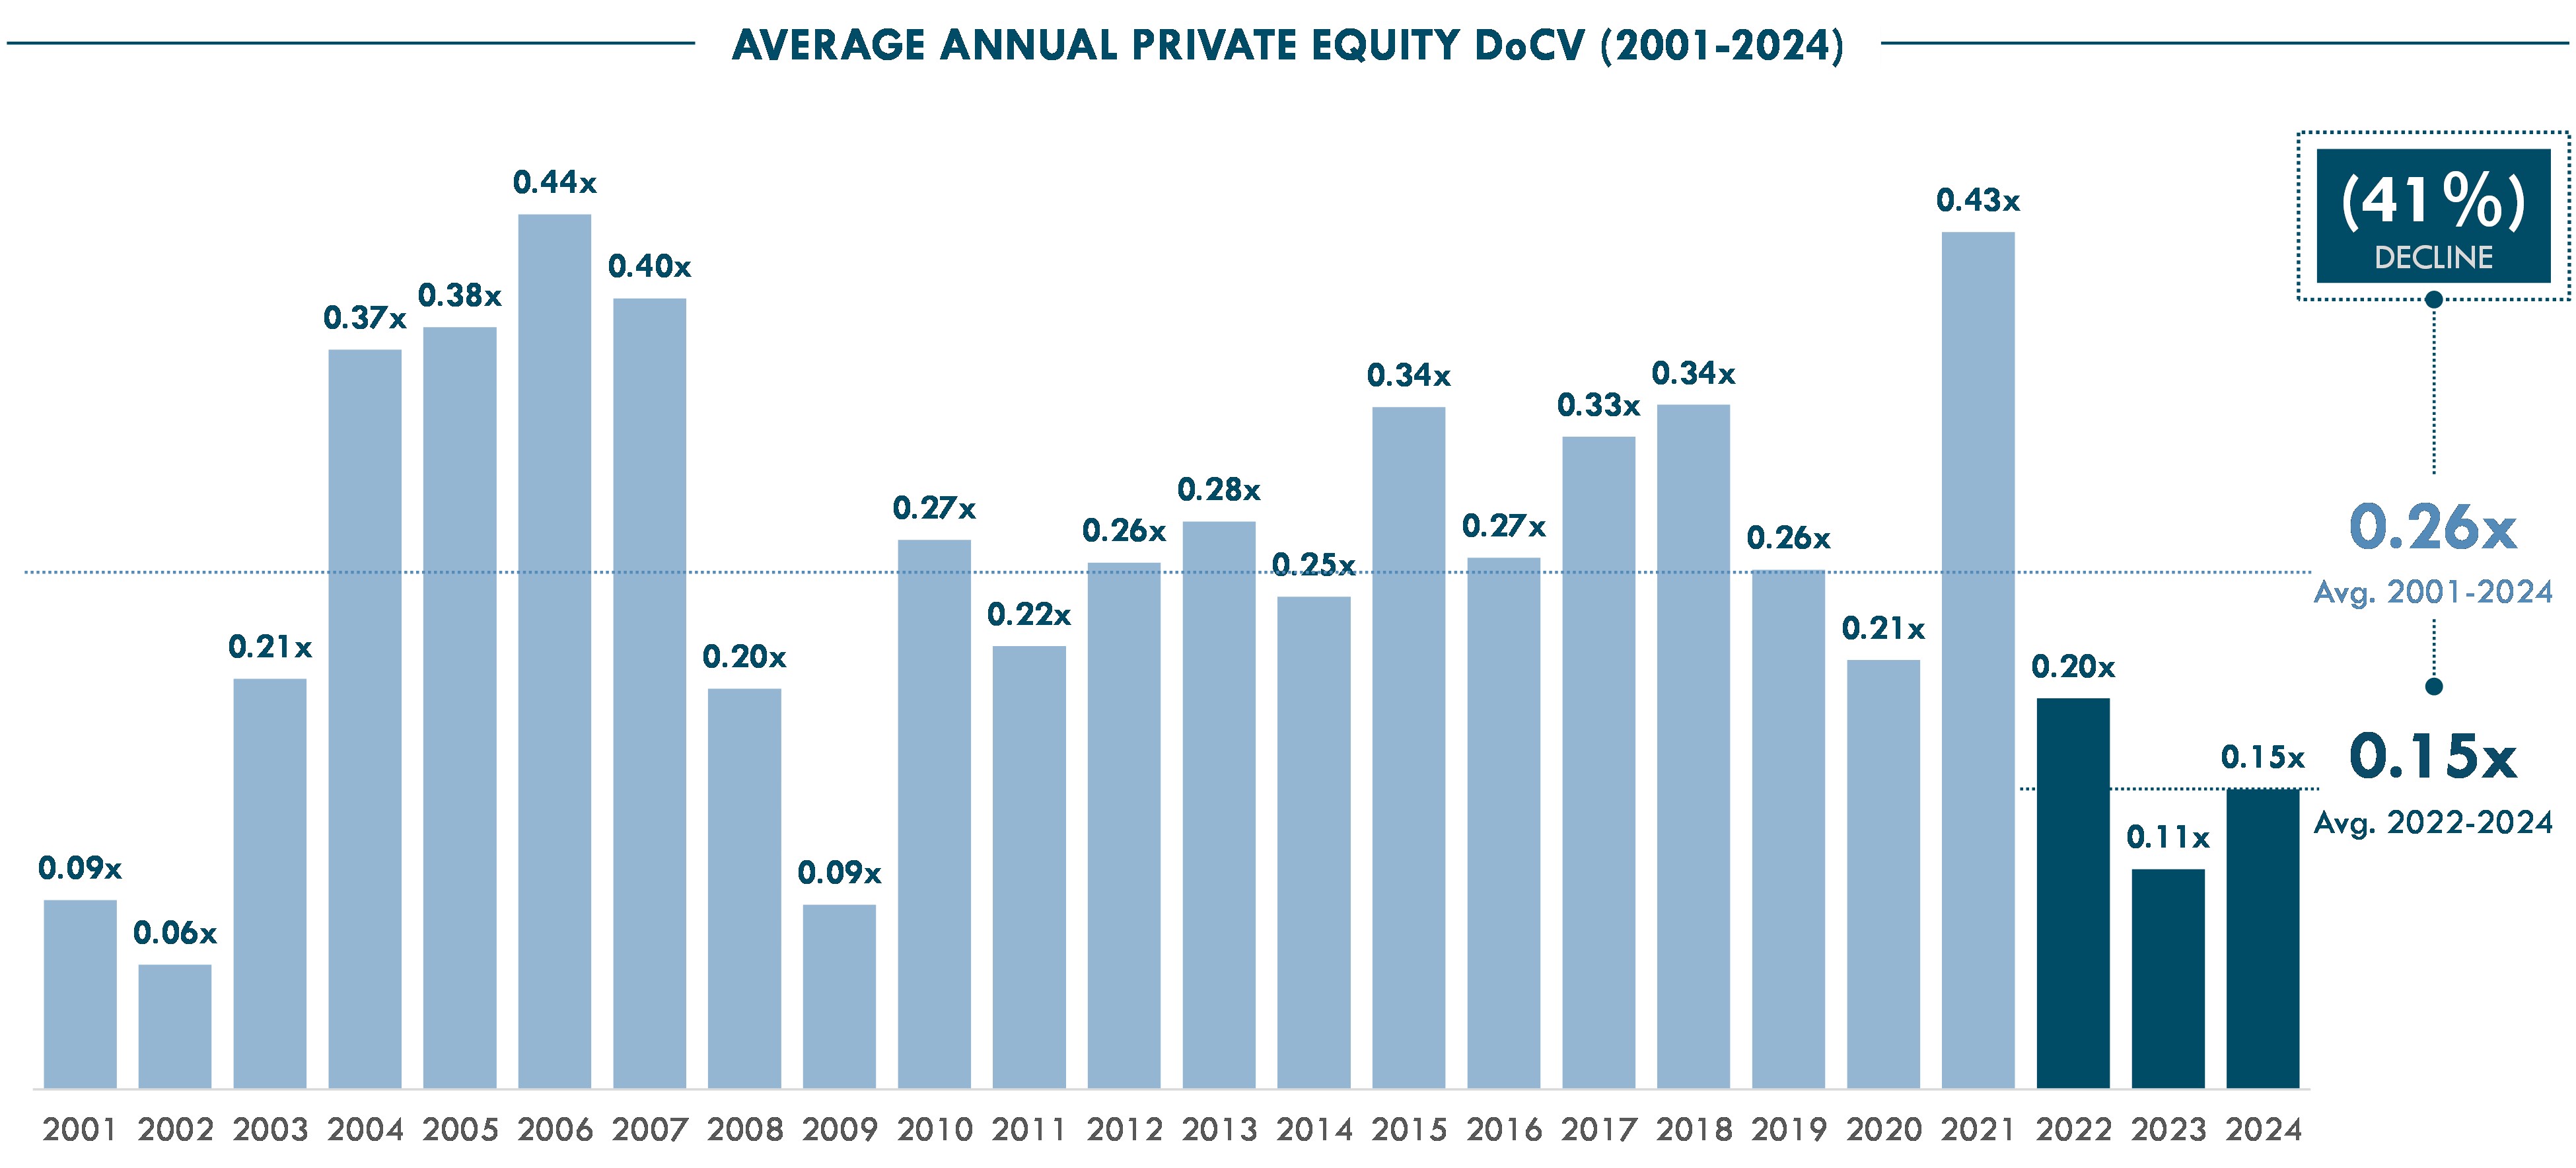
CHART 3.0
Refer to Legal Disclaimers below for more details.
Herein we believe lies the opportunity for GP Financing Solutions to help address these challenges.
The Potential Benefits of Structured GP Financing Solutions
Adding Another Financing Tool to the Toolset
GP Financing Solutions offer non-permanent capital, designed to support specific GP objectives such as funding commitments, acquisition financing, strategic re-investment, succession planning or corporate initiatives. From a GP’s perspective, this can be a non-dilutive form of capital, providing the ability to maintain flexible financing with a defined duration by partnering with strategic financing counterparties.
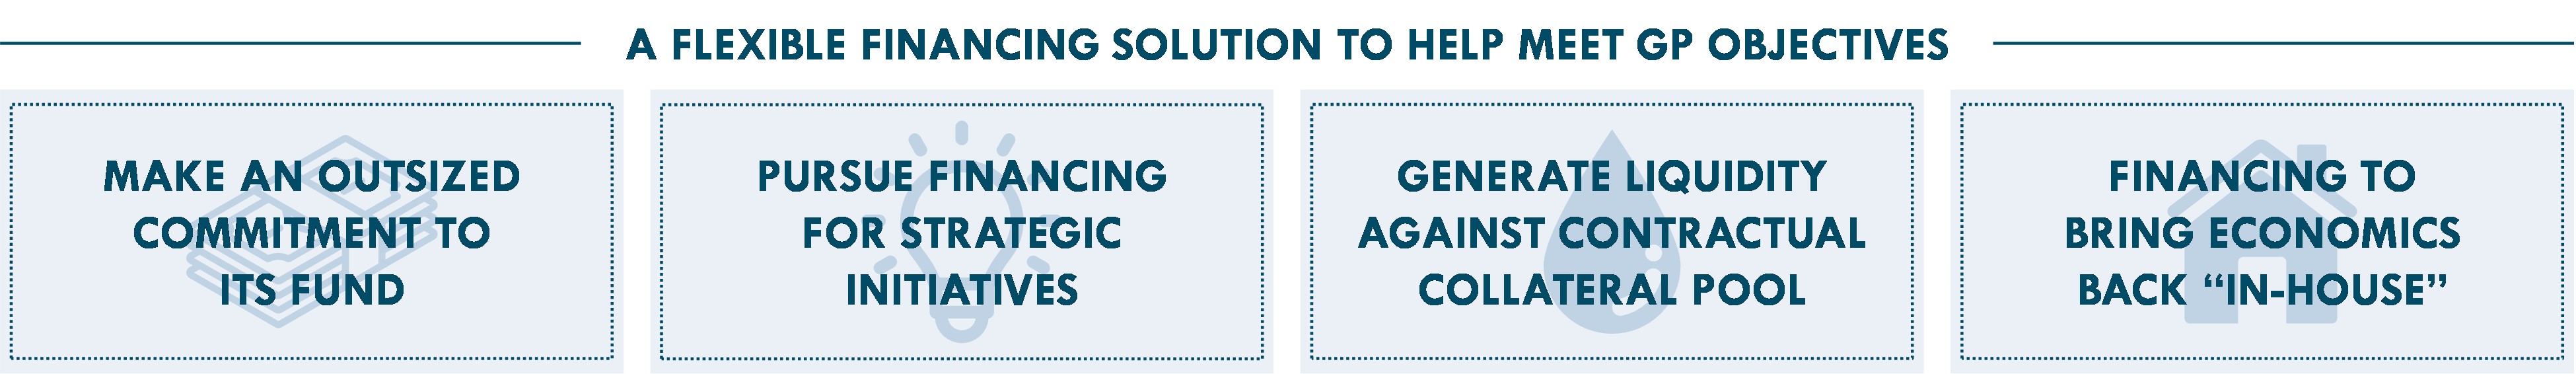
Among other potential use cases, GP Financing Solutions can enable a GP to increase its commitment to its current fund by pledging either in the ground collateral or funding its commitment first, all without giving up ownership. We believe the potential impact of this type of financing can be significant:
- Potential for outsized returns: A $100 million commitment from the GP has the potential to earn 3-5x if the underlying fund returns 2-2.5x and based on certain other transaction term assumptions (see Chart 4.0 below).
- Flexible capital: Solves potential liquidity constraints through flexible capital with a defined duration.
- Increased alignment with LPs: Enables GPs to raise their commitment levels from ~1-2% to 5-10% of fund size.
- Financing for innovative use cases: Non-permanent form of financing for operational needs, seeding new strategies, or launching new business lines.
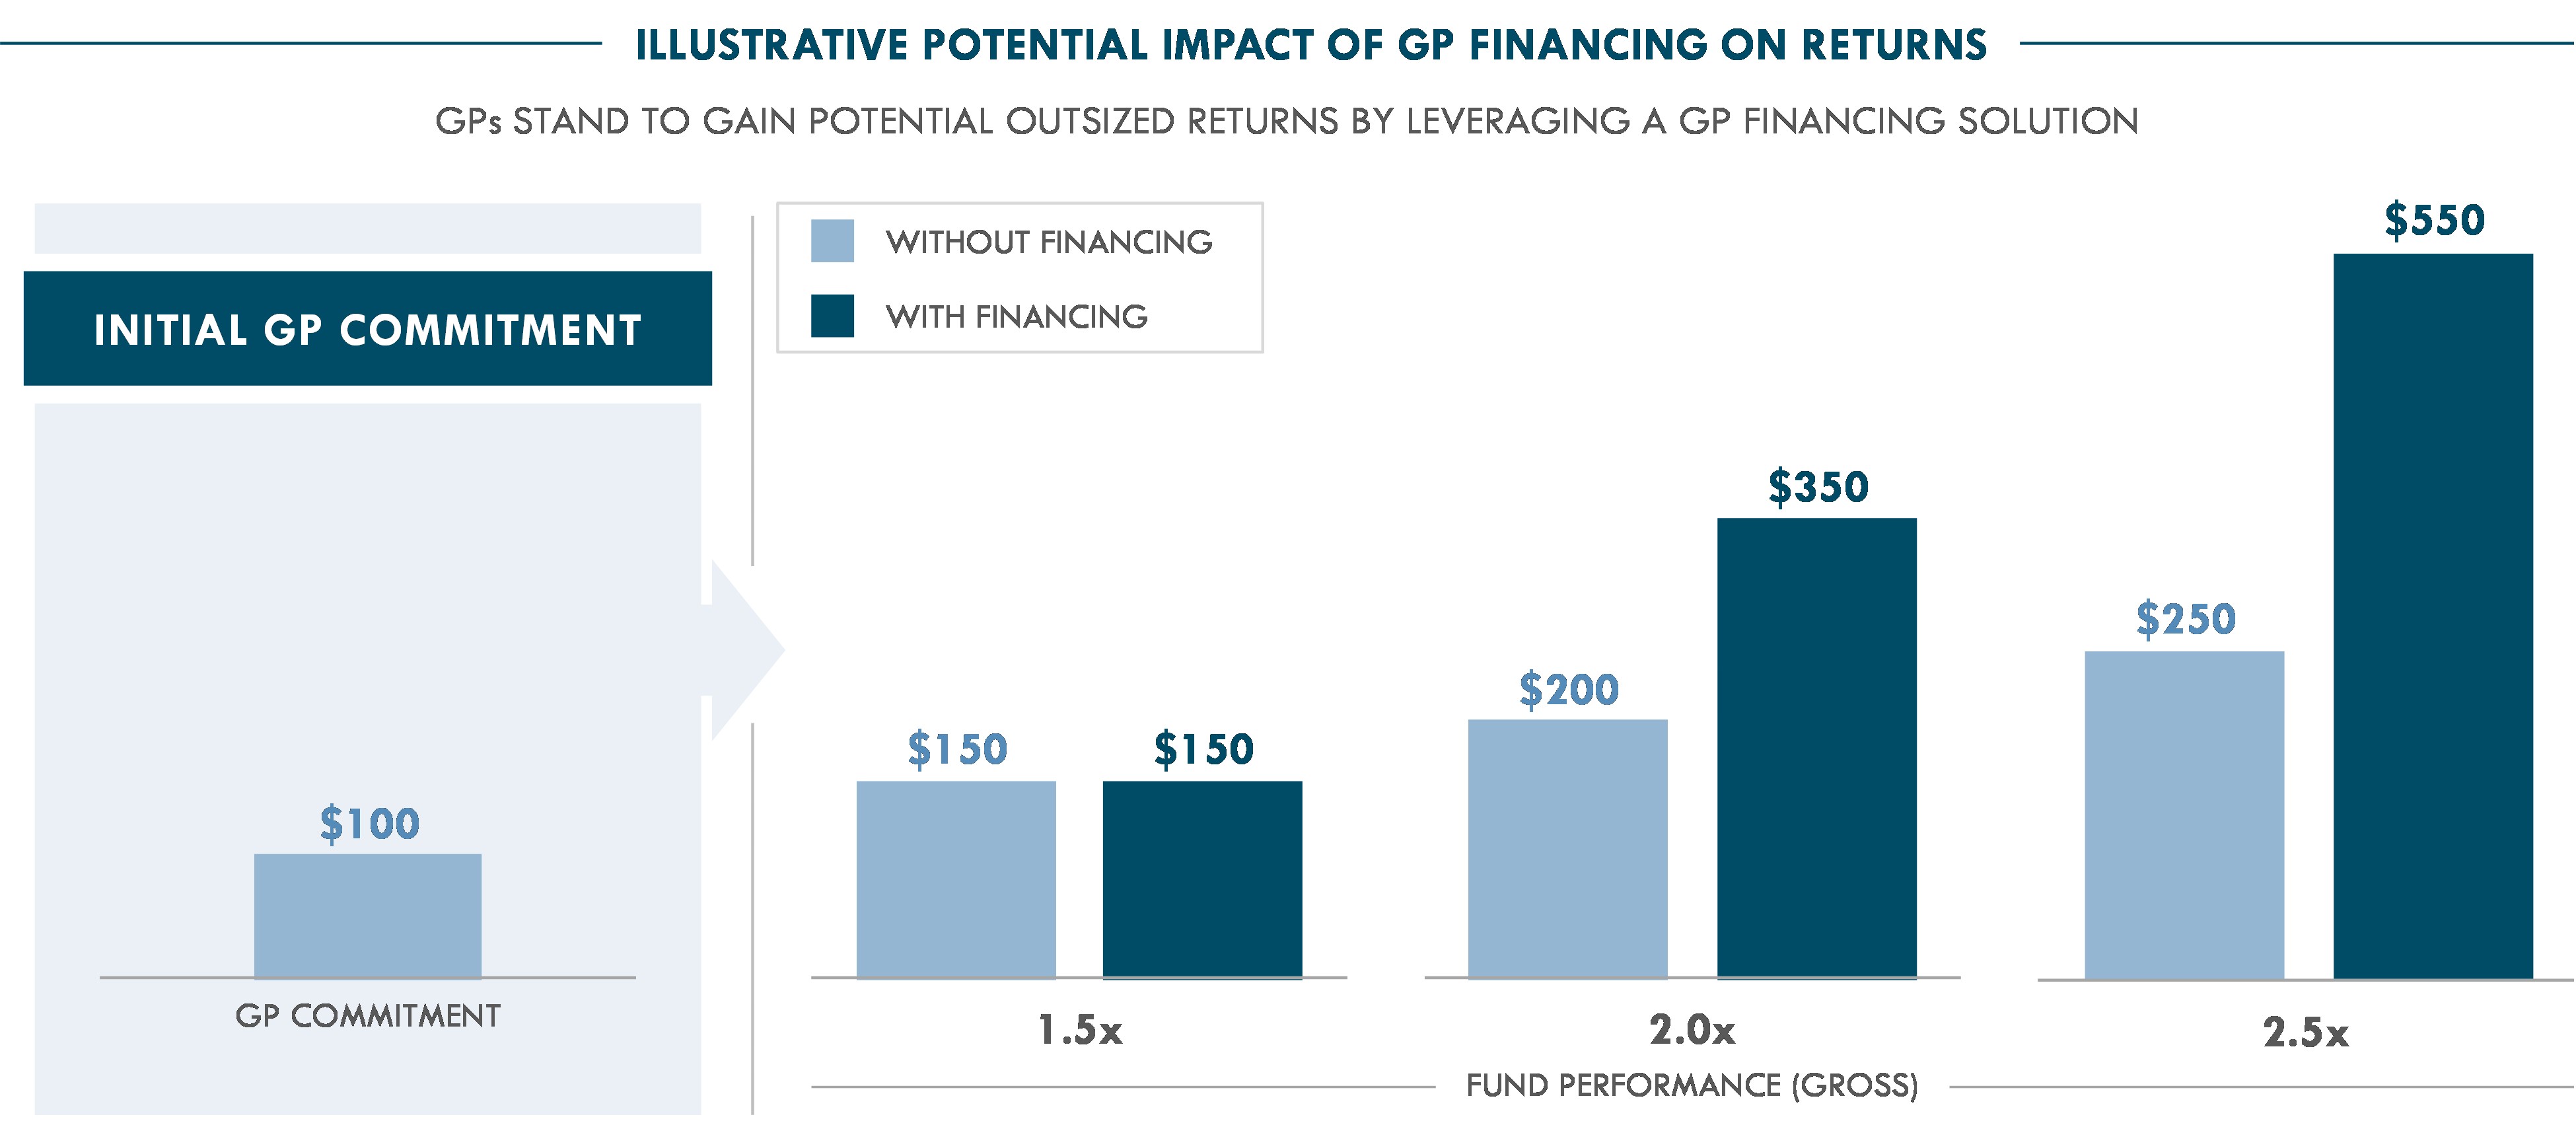
CHART 4.0
Calculations are based on an illustrative $100M GP commitment and GP Financing Solution with a 75% LTV (i.e., $300M advanced from the GP Financing Solution provider) and 1.50x multiple of capital that must be returned to the GP Financing Solution provider prior to distributions to the GP. Refer to Legal Disclaimers below for more details.
And in our view the market need for liquidity alternatives continues to grow. As noted above, Dawson estimates that over $700 billion may be raised by upper middle-market and large-cap buyout GPs this year and next. Assuming these GPs make a 2-5% commitment into each of their newly raised funds, it implies a $14-35 billion market opportunity in the next couple of years for GP commitment financing alone. As GPs seek to increase alignment with LPs with a higher GP commitment, a GP Financing Solution can be additive to traditional bank leverage. We see this as putting more tools in the toolset for GPs to consider when reflecting on their GP commitment size.
Beyond GP commitment financing, we see further opportunity. In fact, over the past three years, fundraising for GP stakes strategies has averaged $12 billion per year according to McKinsey & Company.4 We believe that as these stakes season, managers may seek to buy back stakes, actively manage portfolios or even trade their ownership in the secondary market. Each creating potential new opportunities for the GP Financing Solution. And creating a potential win-win for all parties.
The LP Perspective
For LPs in Funds Managed by GPs Using Structured GP Financing Solutions
Some investors may initially view GP Financing Solutions cautiously, concerned it could create misaligned incentives. But we believe that GP Financing Solutions can maintain or even enhance alignment with LPs by keeping GPs economically invested and focused on what matters most: performance. These tools have the potential to facilitate succession planning and internal equity sharing, improving long-term stability.
Done correctly, GP solutions have the potential to improve outcomes for underlying LPs.
And, in fact, the data to date has supported this. Looking at more than 1,500 PE funds from 2000-2019, we saw an improvement in average fund returns as the GP commitment increased. The difference between GPs making a GP commitment of 2% to over 10% across those funds has equated to on average 200 basis points of IRR accretion and +0.13x on a multiple basis… alignment matters!
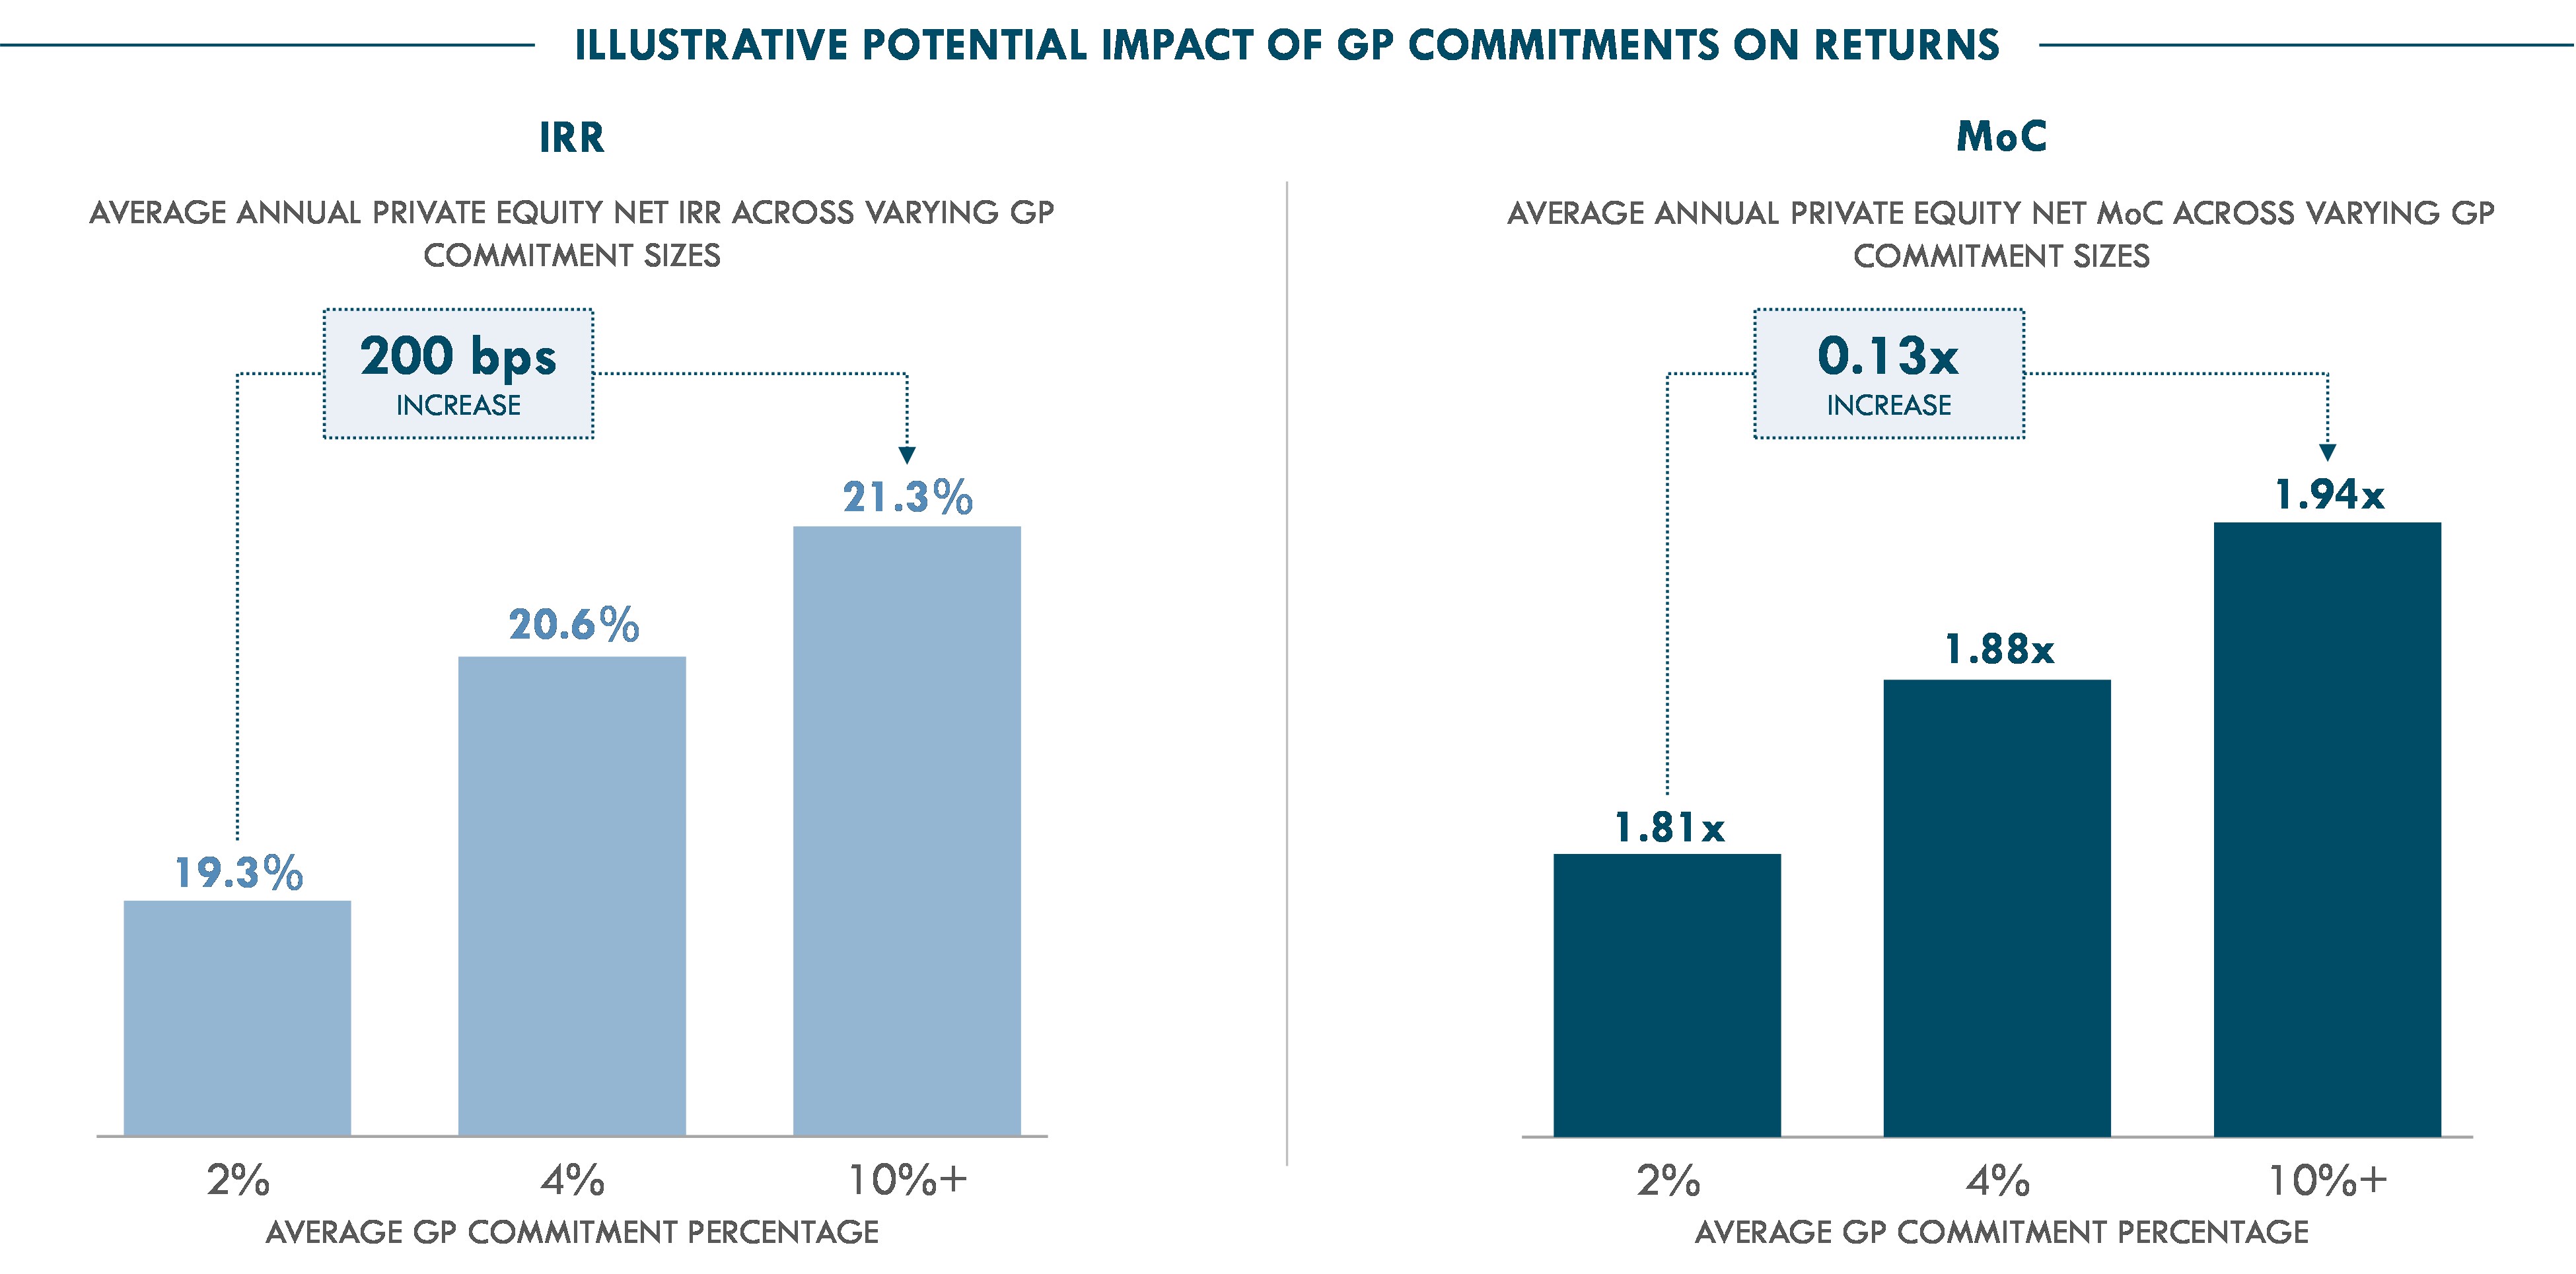
CHART 5.0
Source: “Do GP Commitments Matter?” – Institute for Private Capital (December 2024). Based on data from StepStone, which contains 1,503 private equity funds across 917 GPs with vintages from 2000-2019 making investments in 38 countries across 15 industries. Refer to Legal Disclaimers below for more details.
For Investors in GP Financing Solutions Themselves
This could present an interesting opportunity for an investor – but it remains critical to focus on the quality of GPs utilizing this type of financing to help ensure alignment is there. This strategy offers private market investors a hybrid target return profile: contractual downside protection, priority cash flow arrangements and strong asset coverage, with potential upside tied to fund performance or asset growth.
By solving for duration and alignment not found in traditional GP stakes sales, GP Financing Solutions can provide relatively uncorrelated returns to more traditional investments, especially amid broader market uncertainty. The structural protections and priority on assets that GP Financing Solutions provide have the potential to complement other private market assets, with potentially lower volatility.
Innovation and the Road Ahead
A Growing Segment
At Dawson, we see the need for innovation and structured forms of financing by GPs as a rapidly growing opportunity. One with abundant demand, yet relatively few capital providers. As new use cases for GP Financing Solutions emerge and innovation continues, we believe those sponsors that can dance with the market, have long-term relationships and have the ability to innovate are set up well for success.
Conclusion
GP Financing Solutions are redefining how GPs manage capital and growth without, in our minds, compromising alignment with their LPs. As this market matures, it offers an additional compelling path towards liquidity. GPs and LPs must develop a thoughtful approach to evaluating and deploying. Could these solutions be the key to GPs achieving their objectives while maintaining alignment with LPs? We certainly believe it is another tool in the toolset to help them do so.
Only time will tell how, but we believe if done correctly this innovation will continue to foster a greater evolution of the market.
1Source: “McKinsey Global Private Markets Review 2022” – McKinsey & Company
2Source: “How can banks adapt to the growth of private credit?” – Deloitte Center for Financial Services
3Source: “McKinsey Global Private Markets Report 2025: Braced for shifting weather” – McKinsey & Company
4Source: “McKinsey Global Private Markets Report 2025: Braced for shifting weather” – McKinsey & Company
Legal Disclaimer: Based upon Dawson’s current views informed by published sources and third parties outside Dawson. No assurances can be made that historical trends will continue or that expectations will materialize. Past performance is not indicative of future results. Chart 1.0 leverages S&P Capital IQ Pro data as of November 28, 2025. Share prices are in local currency. Blackstone, KKR, Apollo, Carlyle, and Ares are in U.S. dollars (USD); EQT is in Swedish krona (SEK). Information in Chart 2.0 is provided for illustrative purposes only. The opinions expressed in Chart 2.0 are solely Dawson’s opinions, informed by published sources and third parties outside Dawson, and should not be relied upon in connection with any investment decision. There can be no assurance that any such opinions will prove correct. The comparison chart is included to show certain characteristics selected by Dawson of four different financing solutions. The characteristics were selected based on criteria that Dawson believes to be important. Reasonable parties may disagree with the selections or characterizations. Different selections or characterizations may yield different results. Information in Chart 3.0 is sourced from MSCI data as of September 30, 2025 for 2001-2024. Reflects data for 50th percentile North American buyout funds greater than $250M and represents annual average of fund vintages that are 3 to 10 years old. Selection criteria based on Dawson views. Different criteria would have yielded different results. Dawson would be pleased to discuss criteria further upon request. Distributions-over-Carrying-Value (“DoCV”) calculated as the ratio of distributions to prior year’s ending unrealized carrying value, adjusted for paid-in capital. Hypothetical scenarios in Chart 4.0 are provided for illustrative and informational purposes only, and not intended as an offer to transact or invest. Dawson illustrative scenarios remain subject to further diligence and assume that Minimum IRR does not factor into returns. There can be no assurance that a transaction will be consummated on the terms described herein (or at all). These hypothetical returns have been prepared and are set out for illustrative purposes only, and do not constitute forecasts or projections. They are subject to uncertainties, changes and other risk. There can be no assurance that comparable returns will be achieved, that assumptions will come to fruition or that any investment will be accretive to the GP. Hypothetical scenarios in Chart 5.0 are provided for illustrative and informational purposes only, and not intended as an offer to transact or invest.