

August 2026
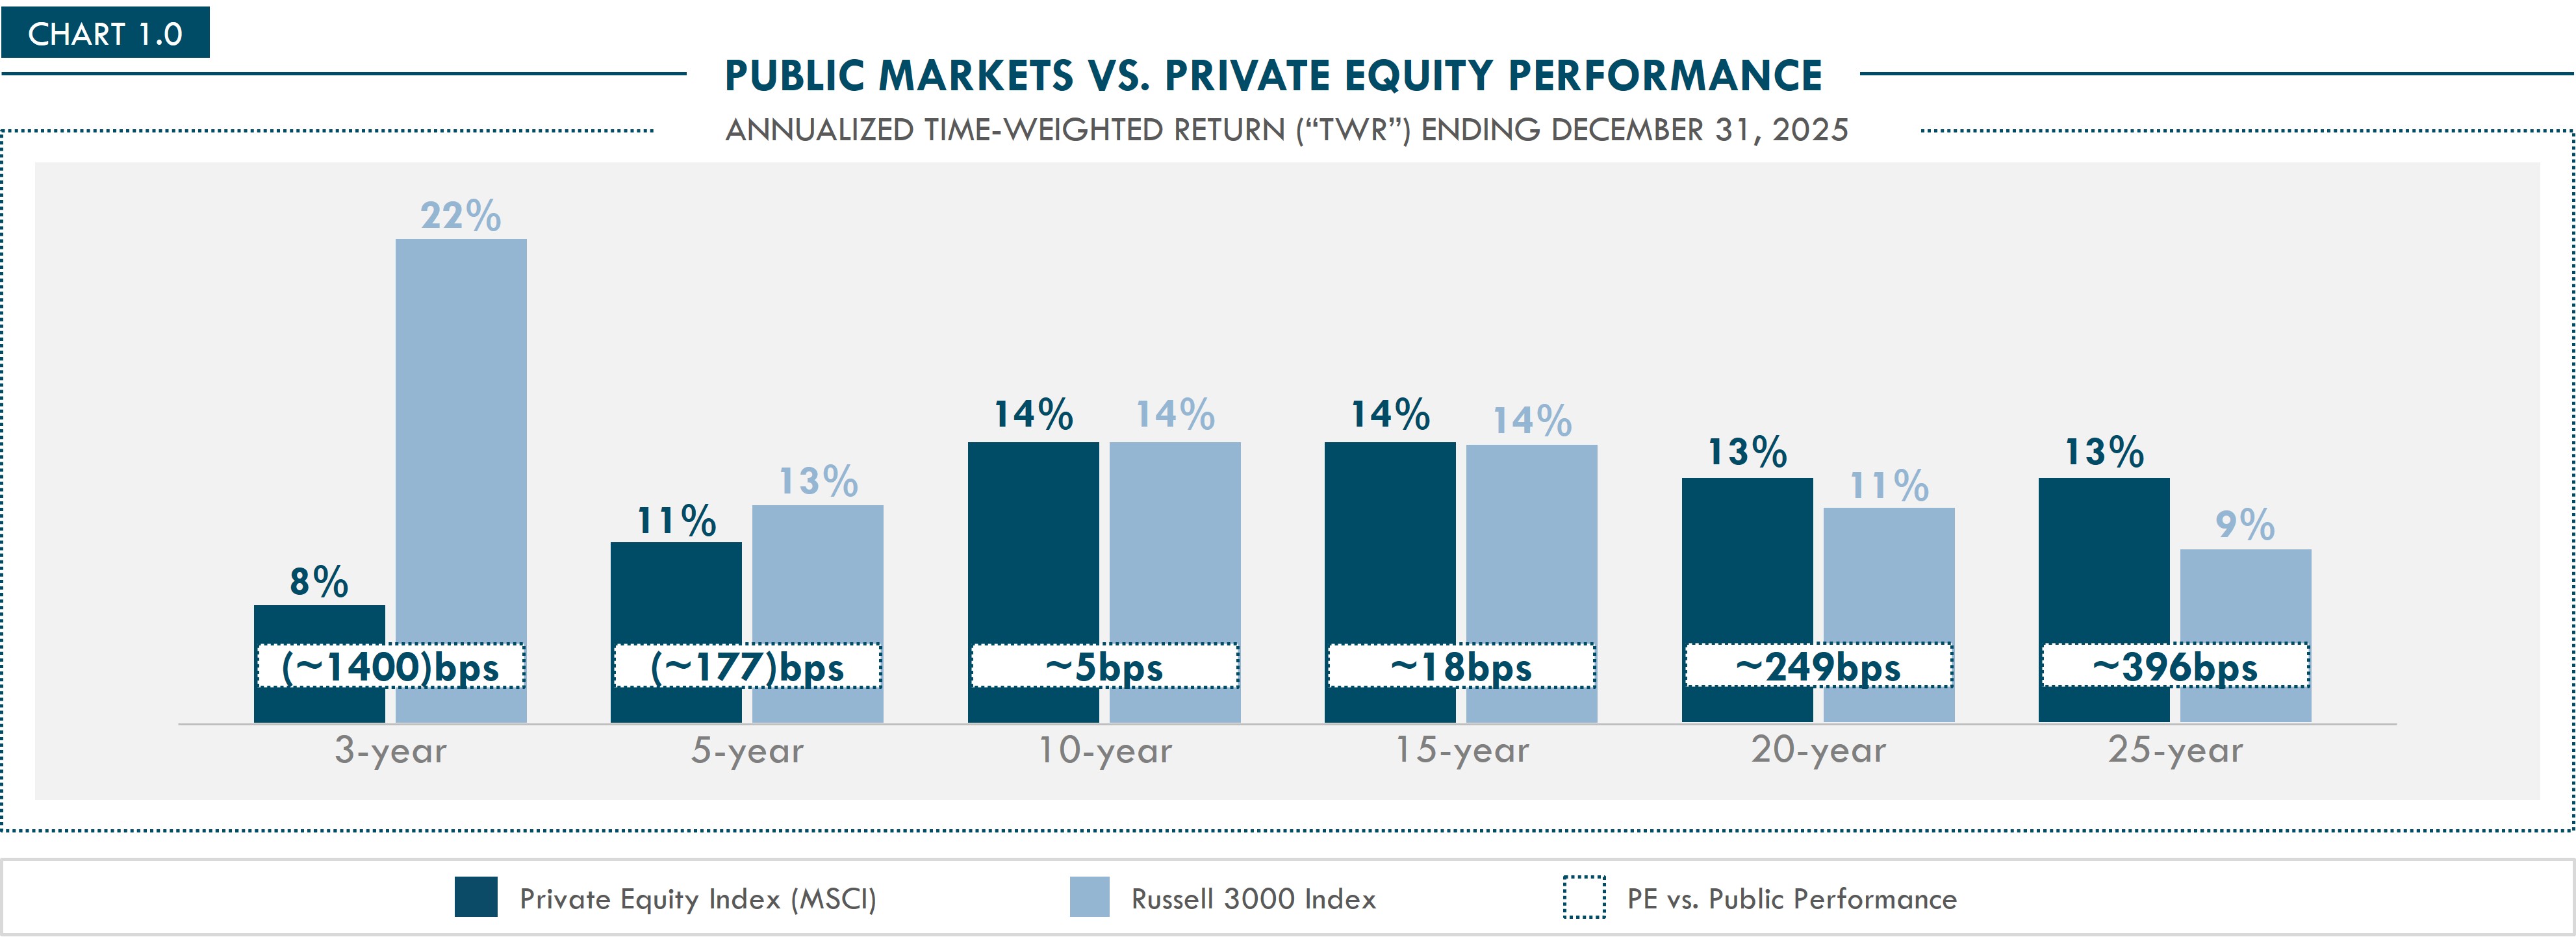
In recent years, private equity returns have moderated. After generating approximately 13% annualized net returns over the past 25 years, PE has moderated to returns of approximately 11% and 8% over the last five and three years respectively (See Chart 1.0). More notably, PE has recently underperformed public equities, an unusual outcome relative to the experience of the prior quarter century. We believe this divergence deserves attention, but not extrapolation.
Our analysis suggests that the recent underperformance of private equity is more likely temporal than structural. Underlying operating performance across PE-backed companies has remained resilient, while a significant portion of recent public market outperformance has been driven by expanding valuations and extraordinary performance from a relatively small number of mega-cap companies. The result is an unusual one: private equity returns are running below their long-term average despite continued double-digit underlying earnings growth, while public equities have generated returns substantially above their long-term average and now trade at a meaningful valuation premium to private markets.
This matters because periods of divergence do not necessarily represent permanent changes in relative return potential. They can also reflect differences in where markets are in their respective cycles.
In Part 1 of Dawson’s Spotlight on Private Equity series, we examined what PE may need in order to generate attractive returns in the next era. Our analysis illustrated potential net returns ranging from ~8% under a multiple contraction scenario to ~16% as additional value-creation levers are introduced (See Part 1 for more context).
In this paper, we put those potential outcomes in a broader portfolio context. We believe PE continues to offer meaningful alpha potential if, as we expect, public and private market performance normalize. But our argument extends beyond returns alone. As the corporate universe has migrated toward private ownership and public markets have grown more concentrated, we believe private equity can play an increasingly important, almost necessary, role in giving investors access to a broader and more diversified opportunity set. All with the potential to generate more stable and resilient returns relative to public markets.
The evolving case for private equity, in our view, is about more than alpha. It is also about portfolio construction and the role that PE can play in investors’ portfolios.

AN UNUSUAL PERIOD OF RELATIVE PERFORMANCE
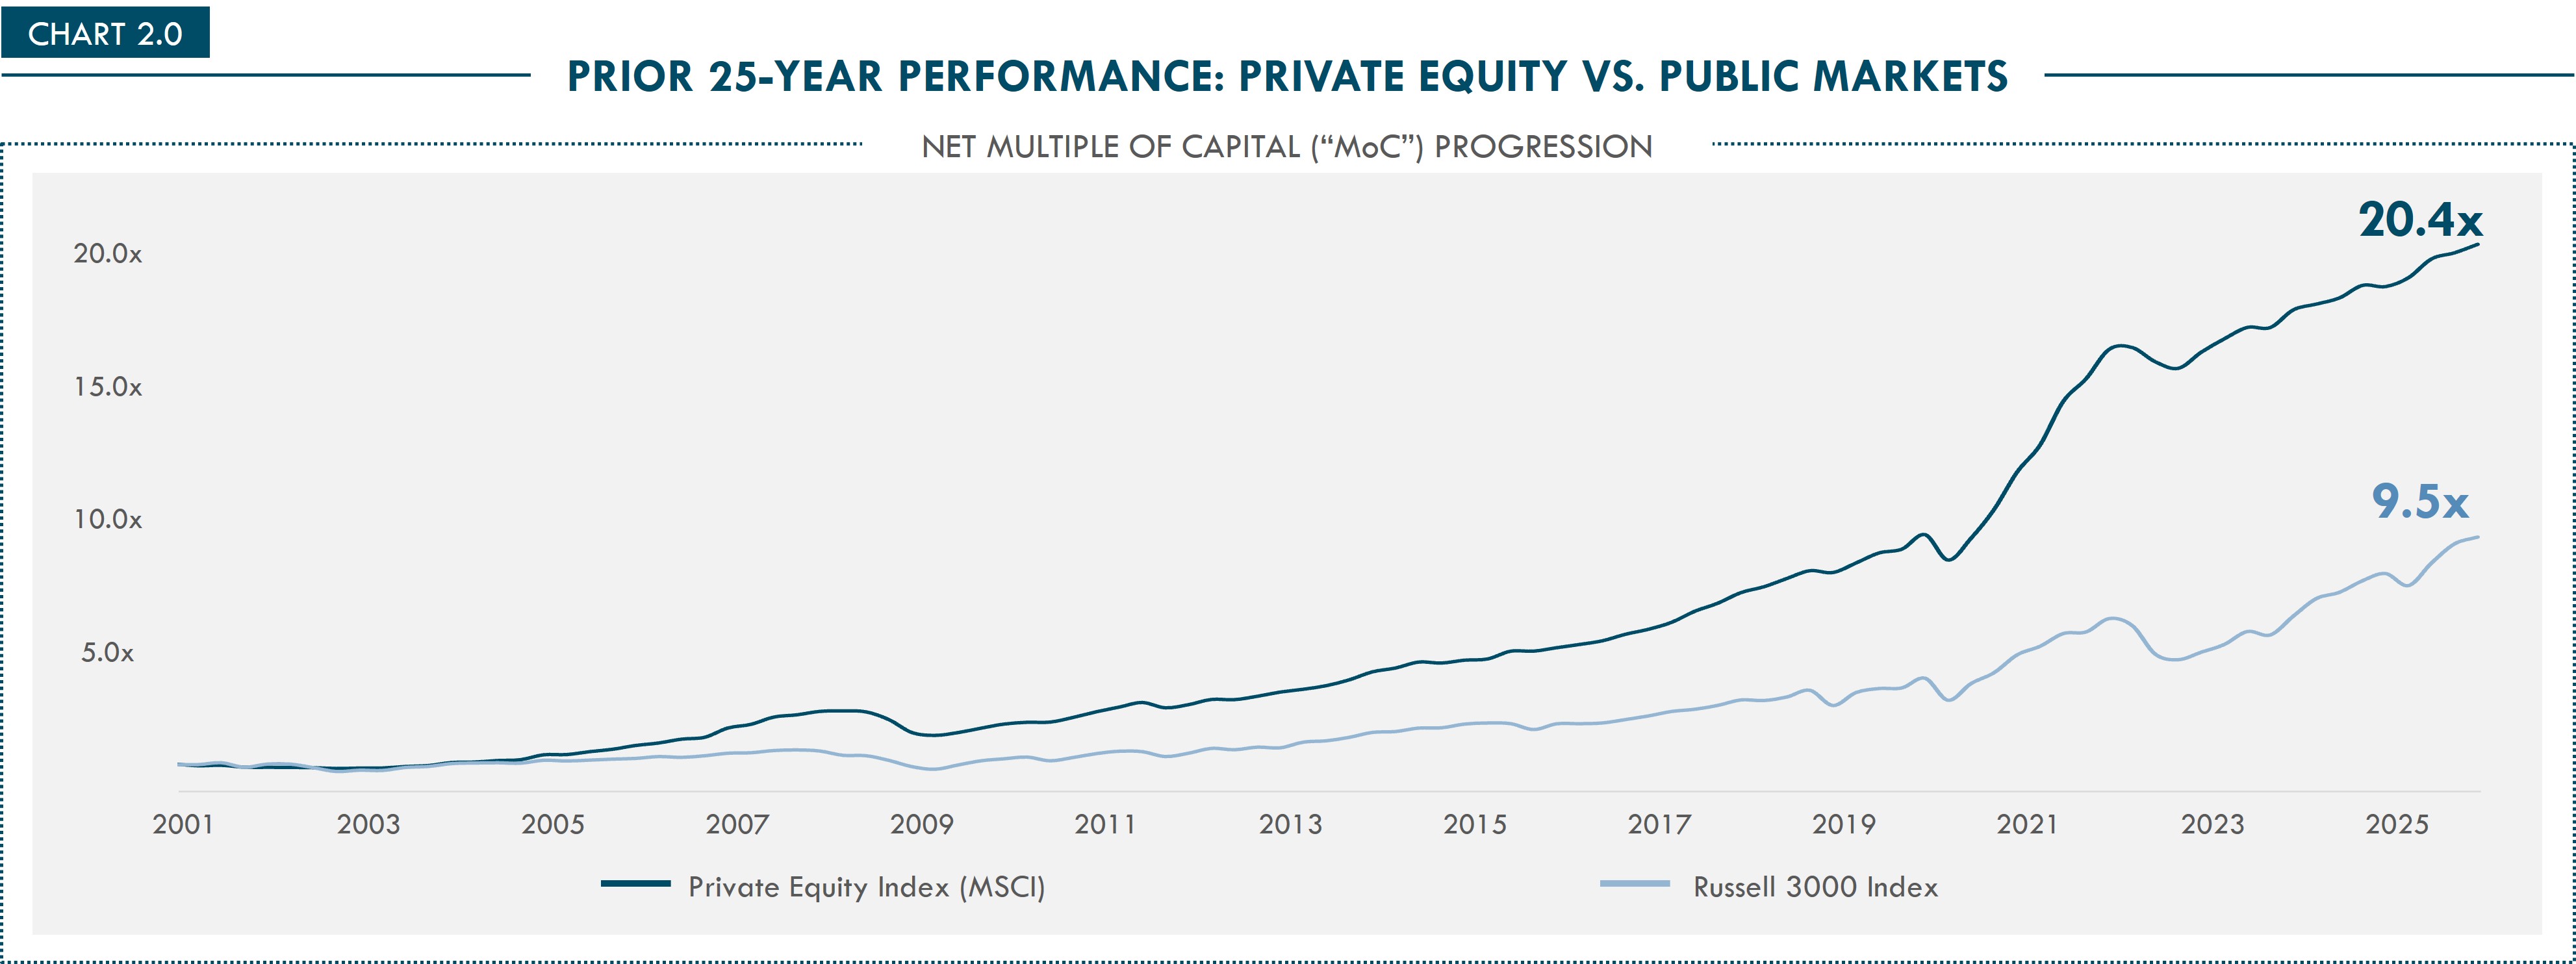
Recent performance in both private equity and public markets stands in contrast with their longer-term records, with private equity currently trailing. Step back, though, and the picture reverses: over the past 25 years, private equity generated approximately 13% annualized net returns versus 9% for the Russell 3000. The difference compounded meaningfully: a dollar invested in private equity over that period would have grown to approximately 20.4x, compared with approximately 9.5x for the Russell 3000 (See Chart 2.0).
The question we ask, therefore, is not whether public markets have recently outperformed. They clearly have. The more important question is why. If recent PE underperformance reflects deteriorating businesses, weakening operating performance, or an impairment of the PE ownership model, then it could represent a structural change in the asset class's return potential; but our analysis suggests something different.
OPERATING PERFORMANCE TELLS A DIFFERENT STORY
While private equity investment returns have moderated particularly over the last three years, the operating performance of PE-backed companies has remained comparatively strong. During this same time, PE has continued to generate approximately 9-13% LTM EBITDA growth, outperforming public markets which has ranged from 0-10%. The growth has also been considerably more consistent than public markets (See Chart 3.0).
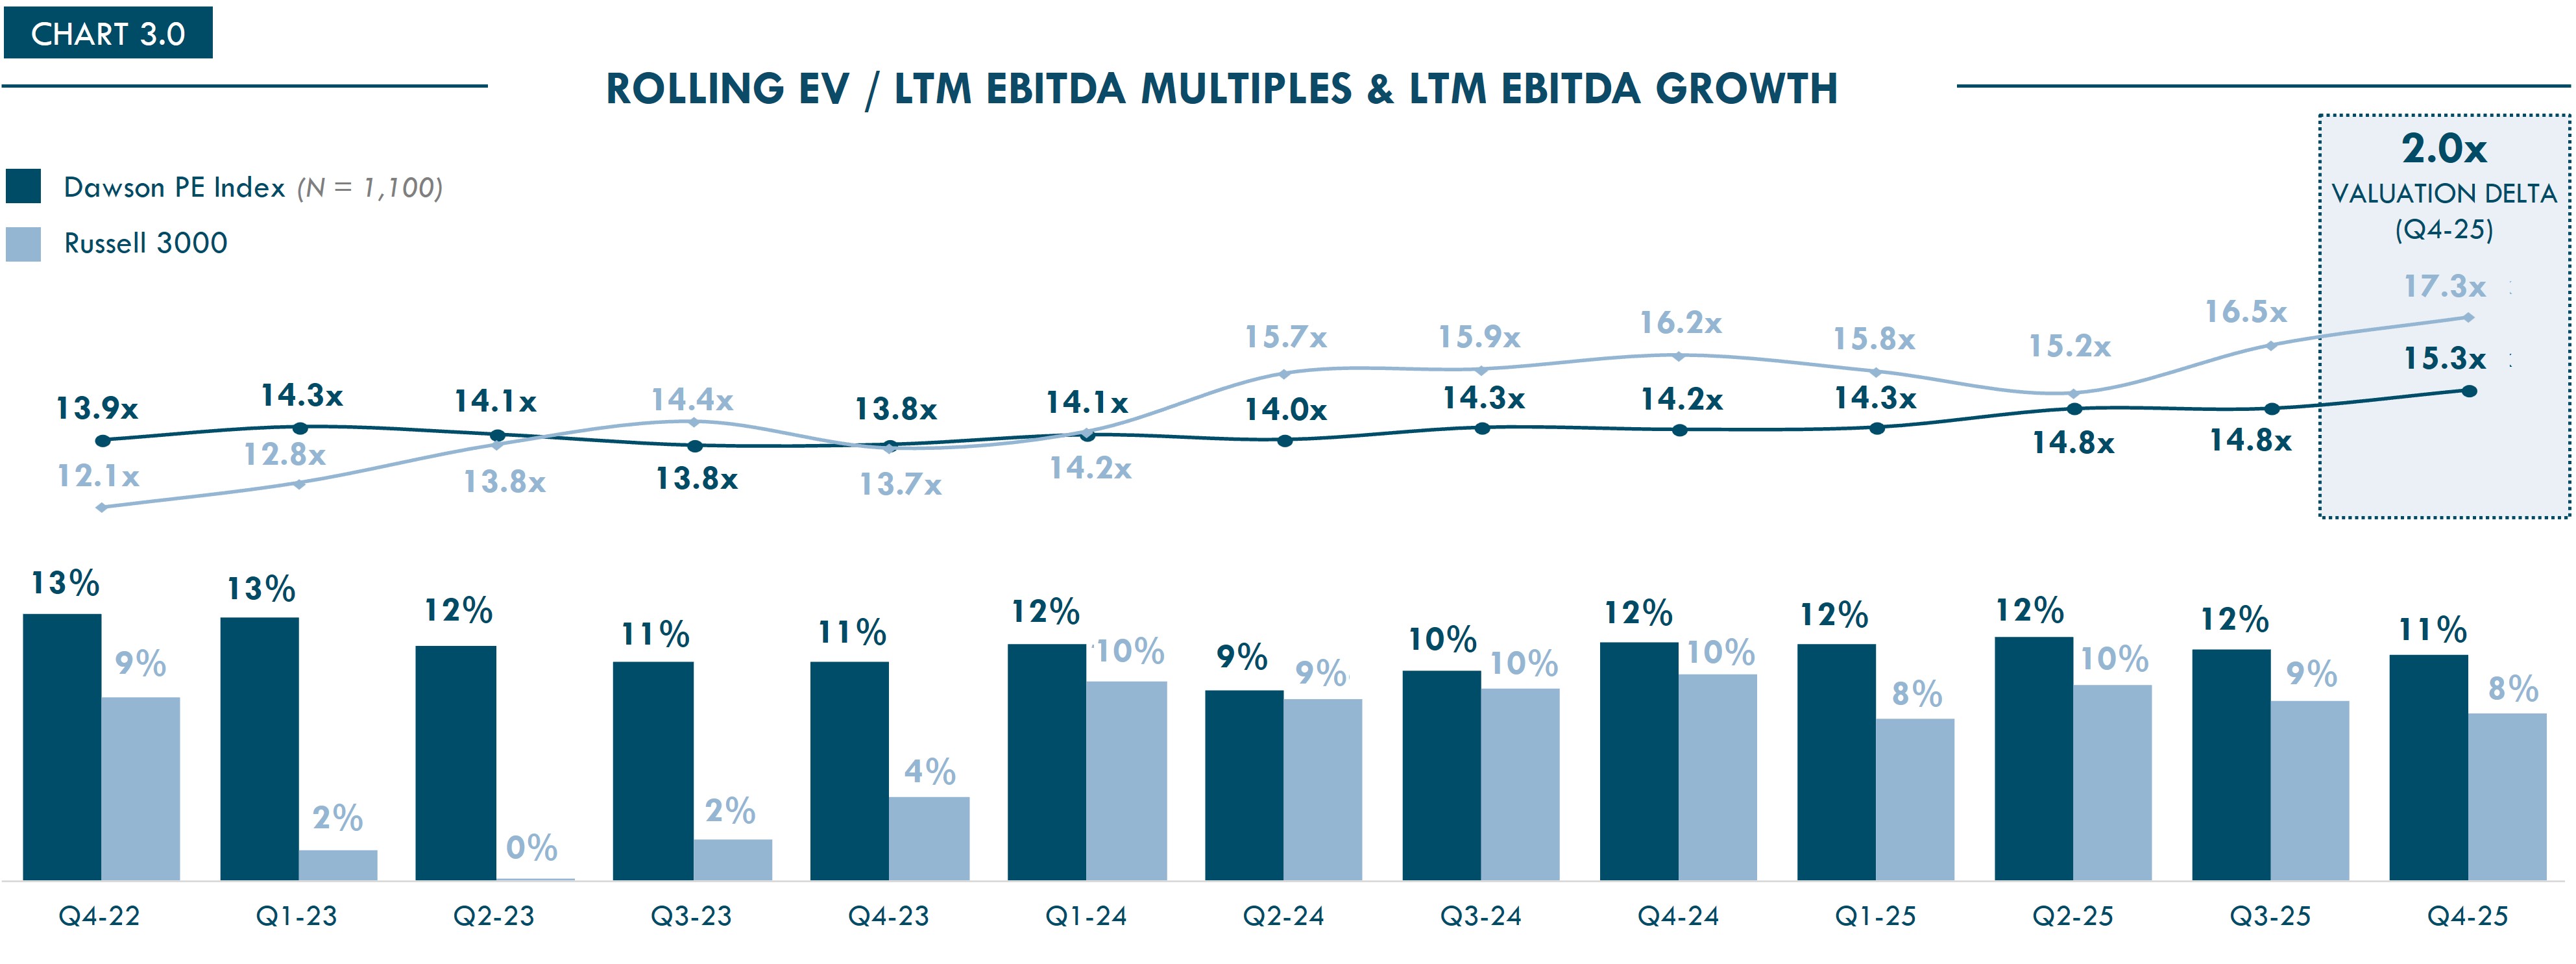
Said differently, recent PE underperformance has occurred despite outperformance of EBITDA. In our view, that makes it difficult to attribute the relative return gap solely to deterioration in the fundamental performance of PE-backed businesses. Instead, an important part of the divergence appears to lie elsewhere: valuations. At the end of 2025, the Russell 3000 traded at approximately 17.3x EV/LTM EBITDA, compared with approximately 15.3x for PE, representing a 2.0-turn premium for public equities (See Chart 3.0). That gap persisted despite private equity's comparatively resilient EBITDA growth.
In other words, as of December 31, 2025, public market investors were paying approximately two additional turns of EBITDA for public companies while the operating performance of PE-backed companies remained comparatively strong. This suggests that public equities may have benefited largely from substantial re-rating of multiples. This can produce significant differences in investment returns even when the underlying private companies are generating more consistent and stronger EBITDA growth.
PUBLIC MARKET PERFORMANCE HAS BEEN EXTRAORDINARY BUT MORE CONCENTRATED
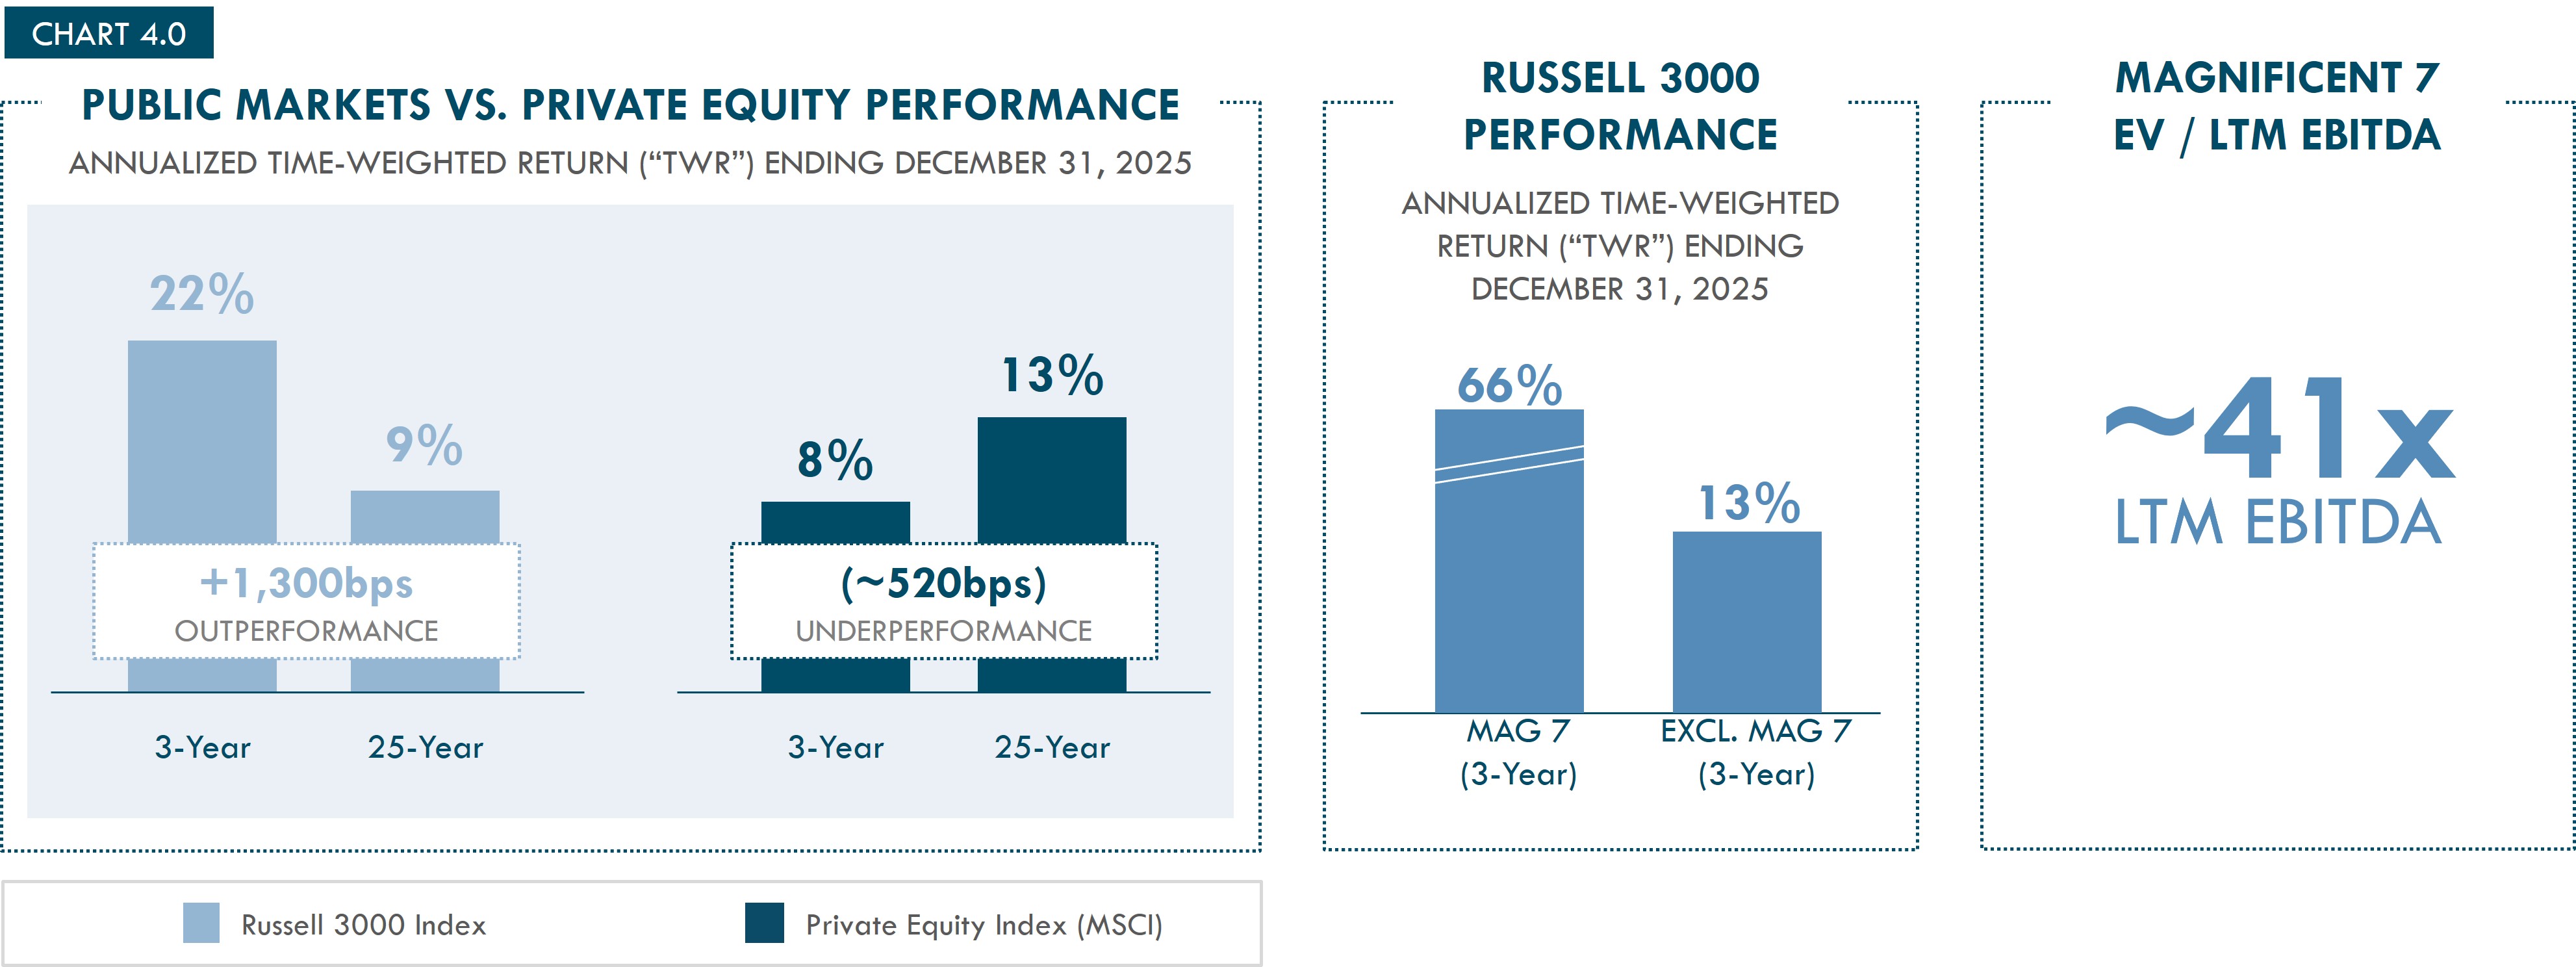
The magnitude of recent public market returns is also important to place in historical context. The Russell 3000 has generated ~22% annualized returns over the past three years, compared with ~9% over the past 25 years. This outperformance is highly concentrated. The Magnificent Seven (“Mag 7”), which traded at ~41x LTM EBITDA, generated ~66% annualized returns over the most recent three-year period. Excluding those seven companies, the remainder of the Russell 3000 generated ~13% annualized returns (See Chart 4.0).
This is not a critique of those businesses. Their performance may ultimately prove justified by future earnings growth. But it reveals that recent public market outperformance has been heavily concentrated, with implications beyond just performance. Today, the top 50 companies represent ~57% of the Russell 3000's total market capitalization, with the Mag 7 alone accounting for ~31%. The comparable figures for private equity look very different: the largest 50 PE-backed companies represent ~ 9% of the private equity universe's enterprise value, with no individual company over 1% (See Chart 5.0).
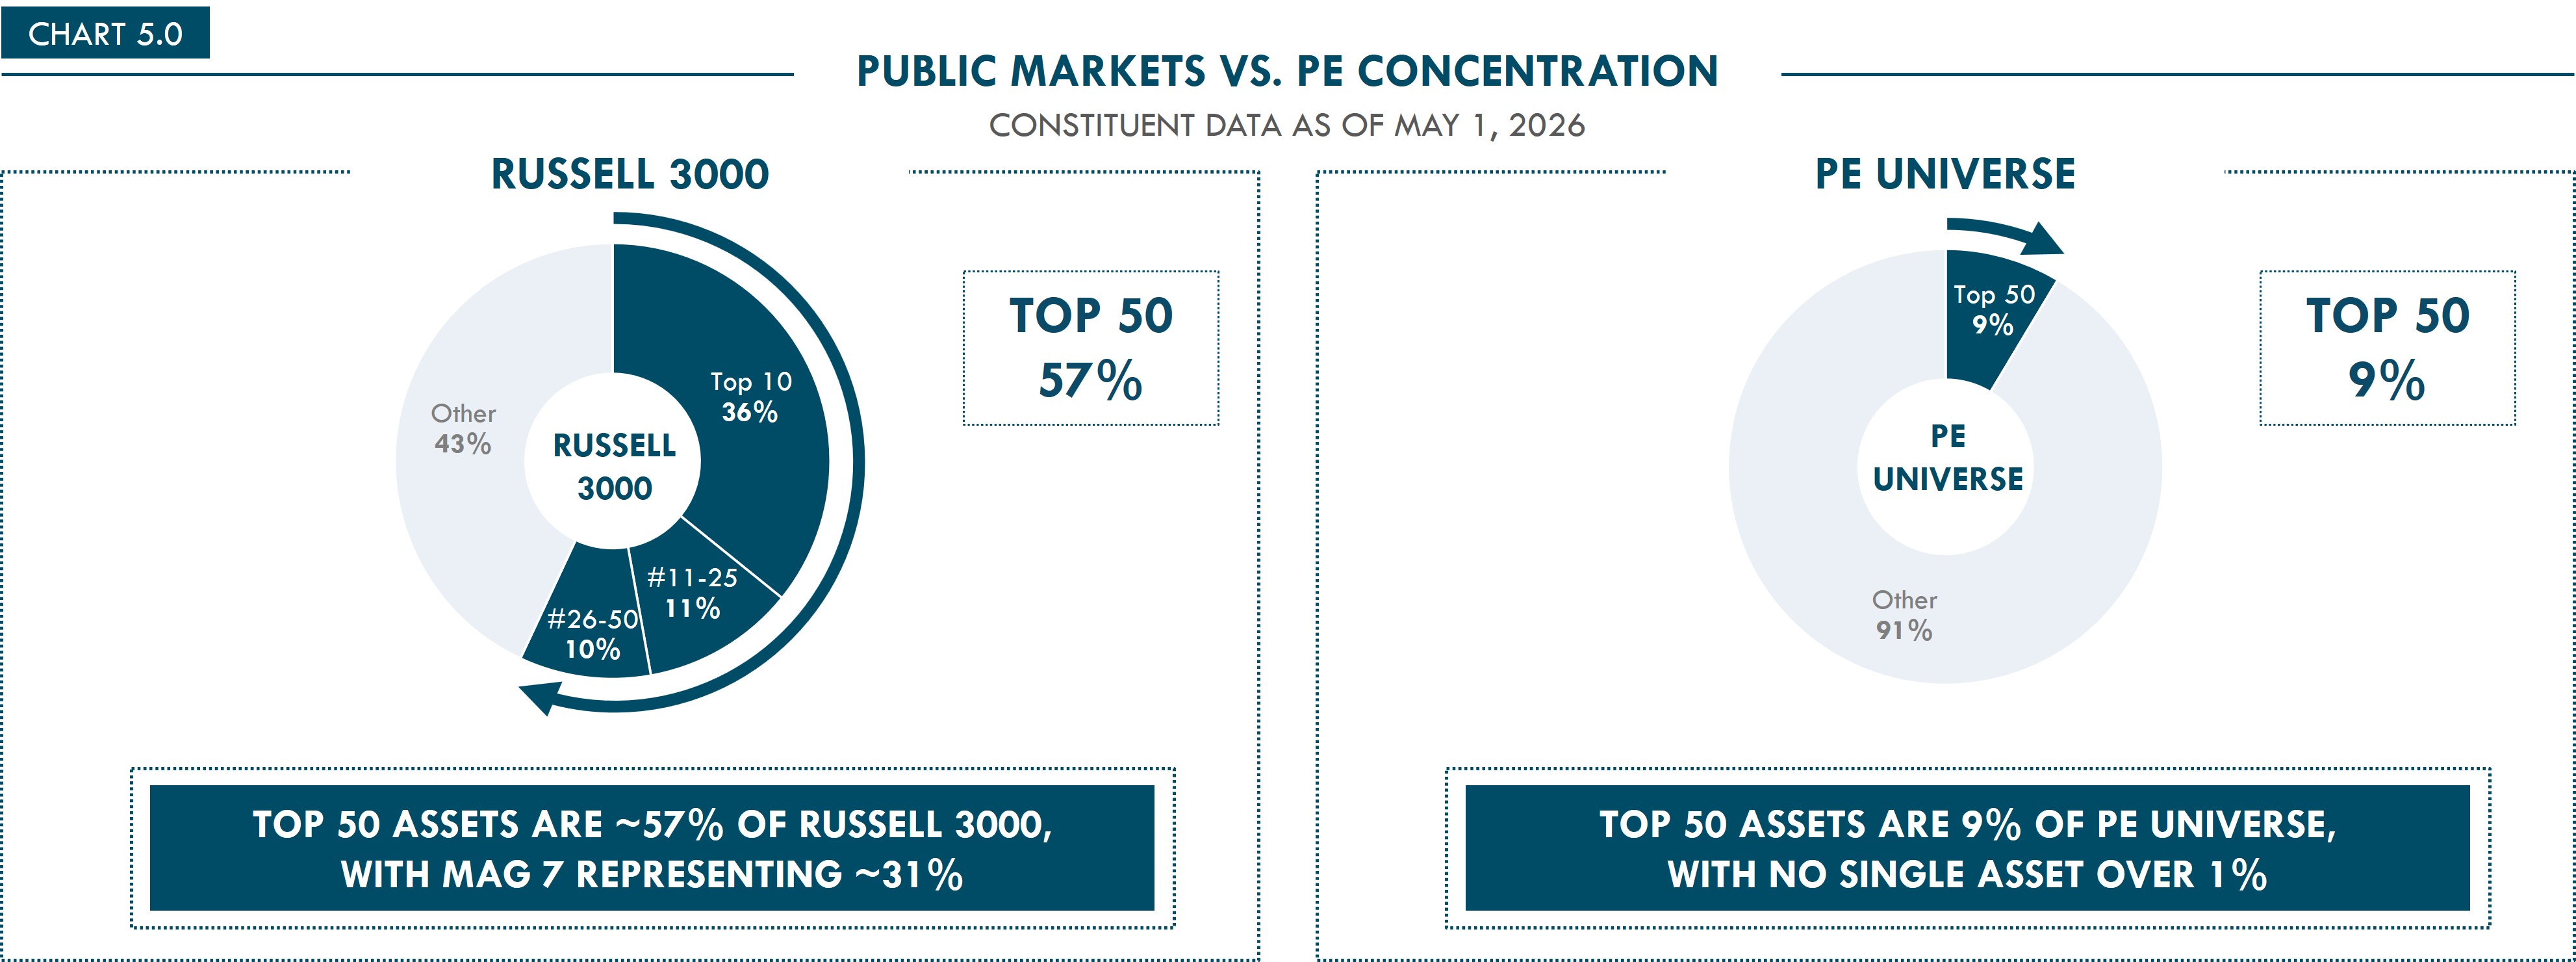
An index containing thousands of securities can appear highly diversified based on its number of holdings while actually being concentrated based on economic exposure. As a relatively small group of companies grows to represent an increasingly large share of index value, investors become more dependent upon the performance, valuations and earnings expectations of an increasingly small subset of companies.
By contrast, private equity can offer a materially different exposure with a broader company universe and substantially less concentration at the top. And increasingly, that private company universe represents a part of the corporate economy that public market investors cannot easily access.
This is the first half of Part 2 of Dawson's three-part Spotlight on Private Equity series.
Click here to read the full whitepaper, where we cover:
- Why more of the corporate opportunity set now resides in private markets
- Why recent relative performance may say more about market cycles than fundamentals
- How the illustrative returns in Part 1’s whitepaper compare within a broader portfolio
Why private equity’s role may be increasingly extending beyond seeking alpha
Legal Disclaimer: Based upon Dawson's current views informed by historical data, published sources, other third parties and Dawson's proprietary database and analysis. Past performance is not indicative of future results. No assurances can be made that historical trends will continue or that expectations will materialize. Note that an investor cannot invest directly in the MSCI index (or in the broader private equity market more generally) and this paper is solely meant to be directional in this regard and for discussion purposes. Full source and methodology details are available in the full whitepaper.