For 15 years we have attributed the following quote to late economist Paul Samuelson, though, admittedly, we can’t find a trace of it now. We remember him saying near the height of the technology bubble of 1999–2000, when stock prices were at astronomical highs, something along the lines of, “Market timing is an investing sin, and for once I recommend that you sin a little.” He meant — if he ever actually said it — that things were so obviously wrong at that time that even a lifelong proselytizer of buy-and-hold would recommend some judicious selling. In attempting to confirm this quote, one of us checked in with Vanguard Group founder Jack Bogle, who could not help us with attribution but admitted to lightening up on stocks himself somewhere near the high. (We can confirm that he did indeed make very prescient and public forecasts of lower than normal expected long-term stock returns at the time.)
If market timing is a sin, then there are times when even the saints can be tempted into sinning a little. We are going to argue that market timing isn’t really a sin except, as for so many things, if done to excess. But the results and logic behind the two simple strategies that govern so much of the investing world — basic value, or contrarian, investing and basic momentum, or trend-following, investing — imply that when it comes to market timing, one should indeed sin a little and do so as a matter of course, not just at extremes.
Today’s high stock prices, and for that matter low bond yields and concomitant low expected future returns (at least in our opinion), naturally bring the timing discussion back to the forefront, leading many investors to wonder if they should get out now. The answer to this question is almost certainly not. “Getting out now” is a very extreme action yet oddly often how people think about market timing (an approach to timing that we will soon label binary, immodest and asymmetric). If, on the other hand, investors wonder whether they should own somewhat fewer stocks and bonds than usual right now — well, that’s a much harder and much more interesting question. Overall, for those who think market timing is infeasible, we give hope. At the other extreme, some observers oversell market timing as easy and reliable. It ain’t.
Some of the strongest evidence seemingly in favor of timing the market comes from studies of long-term “predictability” of stock market returns using valuation measures (like the dividend yield or price-earnings ratio of the market). Perhaps the best-known approach uses Yale University professor Robert Shiller’s version of the P/E ratio for the entire S&P 500 (the cyclically adjusted price-earnings ratio, or CAPE). We’ve been using this method ourselves since the technology bubble. This measure compares the current market price with the average inflation-adjusted earnings per share over the past decade (so as to smooth excessive fluctuations in annual earnings). Currently, the ratio (about 25) shows that equities are very expensive compared with historical levels but not very close to record highs (the CAPE peaked in the 40s in early 2000). Expensive valuations can be bearish timing signals if we expect valuations to revert to their long-run averages. Furthermore, even without this expectation, buying at a higher CAPE is similar to simply buying at a lower yield where all-else-equal you make less even in the steady state.
Let’s look historically at what happened to returns over the next decade when starting from different Shiller P/Es (from now on, when we say P/E or Shiller P/E, we always mean Shiller’s CAPE). Incidentally, we focus on the CAPE for exposition, but many measures of price divided by fundamentals for the market give similar results to what we find in this article. In Exhibit 1 we bucket each ten-year period since 1900 by starting CAPE (looking at it every month) and see what happened, on average, from there.
We see a clear and strong relationship. Decades that started with low P/Es had, on average, subsequently higher average excess (over cash) returns, and decades that started with very high P/Es experienced the opposite: very low average excess returns by historical standards. Of course, like all averages, a lot of variation is obscured by only looking at this summary. There was quite a range around the average decadelong return in each of these buckets. Still, in general, even with such a range, averages count a lot, and other performance measures tell a similar story. For instance, worst cases (if you actually picked the worst of all possible decades among all those in the same bucket) get steadily worse after buying at higher prices. Best cases, while never very bad in any of these buckets, get steadily less good after you buy at higher prices.

So we’re done, right? Market timing is easy! Simply measure the CAPE and act as a contrarian, buying when the P/E is low and selling when it’s high.
Not so fast.
We contrast the lure of graphs like Exhibit 1, which make Shiller P/E look like a very useful contrarian predictor of future market returns, with the somewhat disappointing, at least to us, reality of actual contrarian market-timing performance in Exhibit 2. (If you’re too disappointed after looking at Exhibit 2, don’t despair, as we hope to resurrect things, at least somewhat, from there.) This graph compares the cumulative performance of a buy-and-hold strategy in U.S. large-cap stocks (an unchanging passive 100 percent in equities) with that of a contrarian market-timing strategy that invests varying amounts in equity markets (between 50 and 150 percent every month, moving into cash when bearish and borrowing cash when bullish, depending on where the CAPE is at the month’s start versus history) over the 1900–2014 period. (See the companion piece Inside the Numbers for the geeky details.) Basically, this system is straight value or contrarian: It owns more stocks when the CAPE is low versus history (as high as 150 percent), stays at precisely buy-and-hold (100 percent) when the CAPE is at its historical median and owns fewer stocks when the CAPE is high versus history (as low as 50 percent).
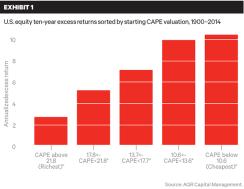
Exhibit 2 plots the cumulative performance (always versus risk-free cash) of buy-and-hold, this simple contrarian CAPE-based timing system and the difference between the two (the outperformance). Note these are gross returns before trading costs, but very low costs are not unrealistic over the past 30-plus years and going forward. We handicap the timing strategy by focusing on only the most basic signals in an effort to prevent data mining — and, we hope, balancing the neglected trading costs.
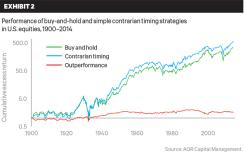
So how does contrarian timing do? It earns higher returns than buy-and-hold over the full period (about 80 basis points per year) but has merely treaded water since the 1950s. It has actually been somewhat less risky than buy-and-hold over this latter period, which is hard to see from the graph but certainly counts. We’ll return to risk later. Outperformance lines can sometimes look anemic just from being plotted on the same scale as total performance. Some of that is going on here, but it’s really pretty anemic any way you look at it.
While we think the full 100-plus years is the most relevant period, failing to add value since the 1950s is, we say with some understatement, a really long time. We think that perhaps few proponents of contrarian timing recognize that their favored strategy, if used every month as in Exhibit 2, with real-time data only looking backward, has not on net worked during most of our lifetimes. (Again, we get similar results if we make different but still reasonable choices, like looking back over different-length periods, trading less frequently, using a different mapping of current versus historical CAPEs to stock market positions and using other reasonable valuation measures. Other researchers, notably Goyal and Welch (2008) and Dimson, Marsh and Staunton (2013) have found similarly disappointing results for contrarian timing strategies.)
So we have a puzzle. Exhibit 1 suggests contrarian market timing using valuation is a very good idea, and many, including us, have shared results of this type. However, Exhibit 2 is, if not outright depressing, hardly a commercial for market timing. And yet both are just using Shiller P/Es and the S&P 500. What’s going on?
Well, there are a few reasons for the difference. We first delve into explaining this for just contrarian, CAPE-based stock market timing before moving on to somewhat redeem more-general market timing. This partial redemption will come from availing ourselves of the two most well-known systematic investing strategies (hint, contrarian investing is only one of them) and the two most well-known asset classes (hint, the stock market is just one of them).
We expect many investors are explicitly or implicitly puzzled by the seeming contradiction between the popularly cited long-term results (Exhibit 1) and their own intuition or evidence that such timing doesn’t help much (Exhibit 2), and we hope to help reconcile these. So why does Exhibit 2 disappoint versus Exhibit 1?
First, put bluntly, Exhibit 1 cheats while Exhibit 2 doesn’t. Hindsight is indeed 20-20. Too often we analyze historical opportunities with the benefit of hindsight, assuming that investors of the past knew more about the future than they could have. (Indeed, simply knowing about the Shiller P/E is a type of hindsight bias, as neither the CAPE nor even Shiller himself has been around this whole period.) For example, the CAPE of the U.S. equity market averaged 13.5 in the first half of the 20th century, 17.0 in the second half and 25.3 from 2000 to the present. Should we assume that our grandparents anticipated this richening trend? More important, such hindsight analysis implicitly assumes that investors knew the boundaries. Did investors know that when the CAPE was in the top or bottom quintile, it never soared beyond or fell below the highest and lowest observed historical values? It is this type of hindsight that we implicitly incorporate when we examine the average or quintile buckets of the whole 1900–2014 period, as in Exhibit 1. The noncheating approach, as employed in the trading rule behind Exhibit 2, involves making forecasts using only data that was available to investors at the time of investing. That is, if an investor was standing in January 1930 and trying to determine if the CAPE was high or low, that investor could only compare the current value with historical values from before 1930.
Please note we are still fans of using evidence like Exhibit 1 in discussing realistic possible scenarios for future long-term returns. It may indeed be the case that looking back over a very long sample and cheating in this manner is the best way to forecast the long-term future. Overstating the power of a technique is not inconsistent with that being the best possible technique to use, and setting long-term expectations is a more modest goal than generating real-time market-timing profits. Furthermore, starting now we’d indeed forecast lower than normal long-term real equity returns because of today’s relatively high CAPE. But, again, forecasting lower long-term returns because prices are currently high turns out to be very different from capitalizing on this by trying to time the market month in and month out.
The long time frame in Exhibit 1 versus the implied short rolling time frame in Exhibit 2 matters even without the hindsight problems. Without going into the math, a measure like CAPE usually changes slowly, making essentially the same forecast for long periods. If it has a little power, that power accumulates, while the randomness around that power diversifies away. An imperfect though perhaps helpful analogy: Imagine you knew for a fact your baseball team had a 0.600 chance of winning each game (it’s baseball, so we write 0.600 instead of 60 percent). Results wildly far away from a 0.600 winning rate are very possible in the short run and become increasingly less possible over the long run. The CAPE is not as unchanging as a set 0.600 chance of winning, but it is way stickier than many short-term signals (which almost by definition cannot have power over the long run). Long-term power like we see in Exhibit 1 will often yield far less impressive short-term power for this reason. Having said all this, the in-sample “cheating” and this long- versus short-horizon effect are still only part of the story.
As alluded to earlier when discussing the long-term upward drift in the CAPE, another related but distinct headwind for contrarian stock market timing in the second half of our sample (really, since the 1950s) has been the decades-long valuation drift in post–World War II equity markets, over which the CAPE gradually doubled (with quite a lot of short-term variation, of course). The average CAPE for the decade immediately following WWII was 12.4, while the average since the year 2000 has been over 25. Thus contrarian timers of the type of Exhibit 2 waiting for the market to revert to what they perceived as normal or even cheap valuations would have been, not always but on average, underinvested in equities (the contrarian strategy of Exhibit 2 is only 90 percent invested, on average, over the past 60 years, instead of averaging 100 percent, which actually costs it approximately 50 basis points a year, a fair amount at these scales and stakes). So it turns out that the postwar history has been bad luck for contrarian stock market timers. Similarly, the past 20 to 30 years have seen bad luck for contrarian bond market timers, who have kept assuming yields would rise back toward historical average (more on bonds soon).
What this tells us about the future is less clear. It does suggest to us that contrarian timing is likely to fare better (long-term) going forward than its anemic performance in the past decades, as we would certainly not forecast another drift upward of similar magnitude. Admittedly, this has a whiff of conjecture. The drift also highlights the more general point that secular changes can be poison to contrarian strategies, which by definition need an anchor to define where we overweight, underweight and stick close to buy-and-hold. Last, and something we can’t address here, there’s always the additional risk that these secular changes are not just random wanderings, which will eventually work themselves out, but justified permanent changes in levels. That is, perhaps the CAPE is higher, but we should never expect it to go back to historical levels. This is a well-known “the world has changed”–type argument. While we tend to be natural cynics, as these arguments abound and are often wrong, they certainly can’t be dismissed.
With all the above caveats, we remain mild optimists about contrarian timing, at least compared with Exhibit 2. Actually, given the more than half a century drift up in valuations, one might have guessed a contrarian strategy would have done worse than it did (while losing on the drift in valuations, it made these losses back by getting the “wiggles” within that drift right). We think a future with more-stable, or perhaps even regressing, valuations would likely be far kinder than the past to such contrarian timing.
There is one final reason for the anemic contrarian performance in Exhibit 2 compared with the long-term average results of Exhibit 1. Financial markets everywhere seem to exhibit momentum, or trending, behavior, and contrarian investors ignore this at their peril. That is, when assets have been rising in recent months, they are more likely to continue to rise near-term, and when they have been recently falling, declines are more likely to follow. Like any financial regularity, momentum works more often than not, not nearly all the time. But in investing, “more often than not” is pretty darn good, and the evidence that momentum, or trend, investing delivers this across a myriad of investments is very strong. In the case of market timing, as we will soon see, trend-following rules (which buy into strength) have a better historical track record in market timing than contrarian rules (which sell into strength). See for instance Faber (2007) regarding the use of trends to time the U.S. stock market (both to generate returns and cut risk) or Moskowitz, Ooi and Pedersen (2012) for a more general discussion of the power of trend following.
A pure contrarian strategy, such as ours, based on the CAPE, essentially fights — or, in finance-speak, shorts — this tendency of assets to trend. If you’re running a purely contrarian strategy, you always buy more right after prices plunge (and the CAPE falls) and sell more right after prices soar (and the CAPE rises). Although that may or may not work out over the long term, it’s facing a short-term headwind that trends continue and the long term can, of course, be influenced by enough short-term knocks. Indeed, we calculate that, over the whole period, simply fighting the tendency of assets to trend, as does contrarian CAPE trading, has cost the contrarian timing strategy about 50 additional basis points a year.
So between fighting an upward drift in prices (CAPEs) that is unlikely to repeat and fighting the successful trend strategy, the contrarian timing strategy looks about 100 basis points a year worse than otherwise. (That is, if the CAPE had not drifted, becoming ever more expensive, and contrarian timing did not have to fight the trend, we estimate that our model would have done about 100 basis points better per year.)
If the drift up in CAPE does not repeat or even reverses, the first 50-basis-point penalty may indeed go away on its own. But assuming that the long-term efficacy of trend following will remain, we have to take action to fix the second 50-basis-point penalty. We do so by incorporating an explicit trend-following strategy into our simple timing process. To show how trend works alone, we repeat our historical market-timing exercise but substitute prior-year performance for CAPE. (Remember to change the sign! High prior-year performance is a good thing if you’re following the trend, high CAPE a bad one if you’re a contrarian.) We follow the same methodology for calculating weights but do so around a signal fundamentally opposite in spirit to the CAPE: the recent performance of equities themselves. We look only at last year’s performance. Some may try to optimize this and come up with more-complex and better-performing rules (at least in backtests), but we stick with a simple method — betting on the one-year trend continuing — that has been effective and tested throughout finance. In real life we may not limit it so strictly — one hopes making real, not just data-mined, improvements. But this is not the place to make ever-more-complex models. Exhibit 3 shows the results of this simple trend-following strategy that owns 150 percent equities when the prior one-year trend is at its 60-year maximum and 50 percent equities when it’s at its 60-year minimum (and is exactly buy-and-hold when at the 60-year median).
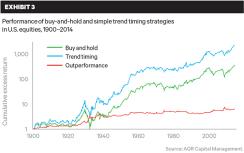
Trend following has added more value than contrarian trading (150 versus 80 basis points per annum over the whole period) and has done better in more-modern times (when contrarian investing has fallen flat).
Of course, it’s a false choice to say an investor must either be a contrarian or a trend follower. Remember that earlier we desired to fix contrarian timing for its tendency to fight the short-term trend? Well, instead of fixing it, let us cave completely and include both trend-following and contrarian-value timing as equal partners. Instead of doing one or the other, we can — and in our view should — do both. A hunter should keep two arrows in the quiver. This would be impossible if contrarian and trend timing were true opposites. Luckily, they are merely opposite in spirit with, as the quants say, mild negative correlation. There are plenty of times when both are bullish or both are bearish. Mechanically, one can simply apply both methods, in our case each yielding a recommended weight from 50 to 150 percent, and simply average the recommendations (thus the weight will still always be between 50 and 150 percent, and generally will be less extreme than either strategy used alone). Using this method, you will then tend to own your most aggressively bullish portfolio when stocks are their best combination of cheap (on CAPE in our example) and performing well lately (on one-year trend), and vice versa (you hate them when they are expensive and trending lower). This tends to give up getting turning points precisely right: Only pure contrarian timing really has that potential, but it suffers for its purity. While giving up nailing the turning points, this combination has proven effective across a wide variety of investing decisions.
We’ll skip the graphs this time (not surprisingly, they look like an average of the graphs in Exhibit 2 and Exhibit 3). The results, as you can imagine from averaging the prior evidence, are not too shabby overall (1.2 percent annual edge) but still very weak over the second half of the sample (adding only 20 basis points per year). Of course, return is not everything (okay, it’s almost everything, but not quite everything). We have left out one very important thing. We’ve acted as if higher return was the only possible goal of timing the market, leaving out the idea of risk entirely. Though this is not the place for a detailed study, a quick examination of risk is in order, as it turns out to be important for the second half of our sample.
Over the first half of the sample, both the contrarian-value and the trend-following timing methods added nontrivial return (and together 2.2 percent per year). Over the second half the combined strategy earned little (and would likely have lost after costs) but was generally less risky for this similar return. Annualized volatility for buy-and-hold was 14.9 percent over this period versus 13.9 percent for the portfolio constructed using both contrarian and trend following. The worst drawdown — if you got in and out at the absolute worst month-ends, how bad could you do? — was –53 percent for buy-and-hold versus –43 percent for the timing combination (with even smaller losses for just trend following). Last, the combined strategy, when compared with contrarian or trend used alone, smoothed your returns in one other way important to many real-world investors. The worst you ever could have underperformed buy-and-hold (forget absolute performance; this is underperforming the benchmark), again using perfectly bad timing, was by 32 percentage points for contrarian timing and 27 percentage points for trend timing but only 17 percentage points for the combination strategy. Investors concerned about relative performance (while many may claim to eschew it, few are indifferent to large and long drawdowns versus the passive investing choice) should appreciate this finding and, in our view, if they engage in timing be even more predisposed to combine disparate signals.
So what’s left? Well, we appear to have ignored the other major asset class. On to bonds! In the place of CAPE, we use a simple measure of contrarian value for bonds: real bond yield. This is just the yield on the ten-year U.S. Treasury minus economists’ forecasts of inflation. Paralleling valuation timing for equities, the exercise is the same as in Exhibit 2 and as described in the sidebar. You simply own more bonds when real yields are high, fewer when low and exactly the buy-and-hold amount when yields are at the historical median. With that out of the way, let’s jump straight to the analogous combination of contrarian timing and trend timing. The results are not too shabby (we again skip the graphs). Over the full period this combination strategy beats buy-and-hold by more than 40 basis points per year (this is bonds, where buy-and-hold makes only about 1.2 percentage points a year over cash, so 40-plus basis points ain’t chump change). Both contrarian and trend timing added value over the full history. As with equities, trend following added more than contrarian timing and, we’d argue, for a similar reason (a secular richening of bonds during the latter part of our sample that hurt contrarian timing). Also, as with equities, we’d still argue for a balanced approach to the two methodologies going forward.
We could indeed keep extending this idea to other asset classes and geographies, and to cross-sectional comparisons (like comparing a diversified portfolio of individual stocks with other stocks, bonds to other bonds and currencies with other currencies). More breadth is always better, but that’s mission creep. Our hunt is taking on the more difficult task here of straight-up market timing. Extending our stock market timing analysis to U.S. bonds over the same period using the same methodology seems a very small leap and we think begs to be included as market timing. But we’ll stop there, content to just mention that more breadth using the same ideas is, of course, expected to be much better.
So let’s examine the obvious next question. What about using both contrarian and trend following (two arrows) for both stocks and bonds (two quarries) within a diversified portfolio of stocks and bonds? Well, if you put half your money in the contrarian-plus-trend stock portfolio and half in the analogous contrarian-plus-trend bond portfolio, what would performance look like versus buy-and-hold, which in this case is always 50-50 stocks and bonds? (The risk-parity lovers in us must note that putting half the dollars but much more than half the risk in stocks is not as diversified as it could be in total returns or in the potential timing returns we study here — an issue for another day.)
You know, looking at Exhibit 4, we might be on to something (just a little something). Doing just these four exceptionally simple types of timing — contrarian value using CAPE for stocks and real bond yield for bonds, and one-year trend following for both stocks and bonds — leads to about 80 basis points per annum better performance over the whole 100-plus years and is still almost 50 basis points better in the second half of the sample (and these numbers count for more versus a 50-50 portfolio than the earlier ones versus equities, as the 50-50 portfolio is less volatile and outperformance similarly more subdued).
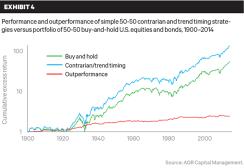
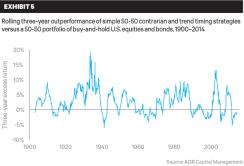
Over the second half of the sample, we also see substantial risk reduction along with the extra 50 basis points. The worst drawdown of the full contrarian-plus-trend stock-bond portfolio versus simple buy-and-hold stocks and bonds (the 50-50 portfolio requires rebalancing, so we’re stretching things calling this buy-and-hold) was –21 percent versus –26 percent, while the worst rolling three years was –10 percent versus –16 percent. Importantly, the value and momentum approaches, and stocks and bonds themselves, again diversify each other nicely. Turning to the worst underperformance versus the buy-and-hold stock-bond portfolio, the full contrarian-plus-trend stock-bond portfolio trailed the 50-50 portfolio by only 7 percentage points at worst (while the trend-only combination had a worst relative drawdown of 17 percentage points and the contrarian-only combination a worst relative drawdown of 15 percentage points against the 50-50 portfolio). Adding almost 100 basis points a year for a century and nearly 50 basis points for the second half, while reducing both absolute and relative risk (in this last case to pretty trivial levels) might not be life changing but is nothing to sneeze at. Not to mention, we still think the results are somewhat understated because of the long-term drift toward more-expensive stocks and bonds. And, for the geekier readers, we really don’t have to apologize for the contrarian strategies. Although they add less return, they substantially lower risk versus the benchmark. The information ratio (which measures the average excess return of a portfolio over its benchmark relative to the volatility of that excess return) of the combo contrarian-plus-trend strategy versus buy-and-hold over our whole period is actually substantially better using contrarian trend (0.45) than pure trend alone (0.33), even though the trend strategy is itself better than the contrarian strategy. As usual, viva la diversification!
Along these lines, allow us one more exhibit. Exhibit 5 looks at every three-year rolling period and shows the 36-month outperformance of the full strategy, timing both stocks and bonds using both contrarian and trend strategies, over the 50-50 buy-and-hold stock-and-bond portfolio. This exhibit is kind of what an information ratio of just under 0.5 looks like over time. There are plenty of three-year periods in which the full combo approach subtracts value (and we know good things get abandoned way too often when they suffer for three to five years). But at this horizon it adds considerably more often than it doesn’t, and historically it has been reasonably well behaved — that is, no superfat tails in either direction.
Let’s sum up the practical takeaways for disciplined market timing:
Combine signals. The long-term track record of trend following is better than contrarian CAPE trading (and similarly, trend following is better than contrarian real bond yield timing in bonds). But this is not the only evidence we have. Across investing, contrarian and trend strategies tend to pay off and diversify each other and seem to work best as equal partners. We certainly do not recommend looking at each area of investing separately and choosing which worked better in a backtest. For instance, in the world of stock picking (trying to outperform a given index not through timing but through fully invested stock selection), there is the famous exception of Japan, where value investing has utterly dominated momentum investing (the opposite of the result we found here for timing). This has occurred, yet we definitely do not recommend doing only contrarian or value within Japan versus zero momentum or trend. We think that would be way too large a concession to data mining. In the case of timing, one could make an argument that trend following is more robust. A trend is a trend; it’s easy to define, whereas valuation measures may have long drifts, perhaps for some valid reasons, making them more difficult to compare through time. In a cross-sectional (for example, stock-picking) model, perhaps much of that drift is irrelevant, as it’s present on both sides of the ledger. Thus, if pressed, we could come up with reasons to lean more toward trend than contrarian for timing and wouldn’t oppose others who might choose to do this. But for us the gains, even in backtests, of overweighting trend signals versus contrarian ones are small, and the discipline of not always coming up with a story to fit what’s worked better dominates.
Include at least stock and bond timing. Breadth is good when you have real but low-return-for-risk signals (actually, breadth is always good but especially important in this case). Comprehensive breadth means using contrarian and trend (along with other tested styles, like leaning toward low risk, high quality and high carry when applicable) in as many places as possible. In the narrower context of market timing, which is what we study here, we find even the limited breadth of timing two asset classes instead of one is important.
Have modest expectations. Market timing is not a sin, particularly if based on the same principles — value and momentum — ubiquitous in modern investing. However, it is also not a high-return-for-risk strategy. This fits intuition. In our view anyone claiming to have very high-return-for-risk timing systems should be taken with a grain of salt. We believe the proper thing to do with low-return-for-risk strategies is not to ignore or eschew them. The proper thing is to do them, but only in very moderate amounts. Portfolio theory doesn’t tell us to only do the very best things but to do everything that can add value proportional to how good it is (considering things like correlations and other factors). We are serious when we say, “If you sin, then sin only a little.” Also, as part of having modest expectations, be willing to accept the gains to value- and trend-based market timing either through higher returns or lower risks or some combination of the two. The results show that over the long term you usually get one or the other and sometimes both.
Act symmetrically. We jumped right to building the strategies this way, but many who examine market timing, for reasons we do not understand, examine asymmetric strategies where often all their process can do is get out of stocks (or bonds). That is a serious handicap, as it makes use of timing signals only half the time. It’s also biased to be a failure, as all you can do is occasionally own less of an asset like stocks and bonds that sport a long-term positive return. That can help mitigate risk, as we saw with our two-sided strategy from 1957 to 2014, but unless it’s extremely, and we think unrealistically, powerful, it is not likely to improve returns. Indeed, looking at the powerful long-term results in Exhibit 1, even in the worst bucket excess returns were positive. Making money shorting or underweighting positive things is hard. It’s much easier if you’re allowed to try the more modest task of owning less when they’re less positive and more when they’re more positive.
Don’t be binary. Many popular studies of market timing don’t just act asymmetrically but only have one action — not just getting out of stocks or bonds but getting out entirely. That’s patently silly whether you believe in value and momentum or just one of the two or likely anything else. Frankly, we find it extremely unlikely that you don’t ever have opinions of different degree. In addition, systems based on large binary moves at specific cutoffs are more vulnerable to concerns of data mining (we promise most such systems you see have chosen the arbitrary cutoffs that ex post have worked best or nearly best).
As a case study of how not to think about market timing, there is a widespread argument against timing that carries out the near-precise opposite of our recommendations (it’s as if they read this article and shorted it). This is the oft-repeated study of “What if you missed the very best days for the market?” Many have conducted or repeated results from such studies as if it’s wisdom. It is not. Such studies are done in different forms (sometimes it’s days, sometimes months, sometimes something else), but essentially it points out that if you miss just the few best times for the market, you give up tons and tons of return. The implicit or explicit message is that market timing is thus reckless, dangerous and foolish. That may be true (we argue that it’s not in small doses), but it’s not because of these silly studies. They violate perfectly all of our applicable recommendations. The timing is extreme, going all the way from fully invested to zero on a dime, which implies a ton of confidence, not modest expectations. It is asymmetric, only allowing bearish sentiment. And it’s extremely binary, containing literally only two states of the world: fully invested or fully out. Another way to sum up these studies is, “If all you did was occasionally radically move all the way from 100 percent invested to 100 percent in cash, without the ability to ever go the other way or act in moderation, and you got it precisely exactly willfully incredibly perfectly wrong, then that would be very bad.” If that sounds like an obvious and empty statement, you’re following along perfectly. It’s not a serious admonition against timing. (Reverse the exercise to similar unrealistic and silly great timing, study the effect if you missed only the worst days, and you’ll find equally silly but wonderful results.) If the market timing we study and advocate for is a venial sin, these studies engage in sins approaching the mortal category.
We have done two related things in this article.
First, we have tried to reconcile what looks like long-term, very successful CAPE-based contrarian timing (Exhibit 1) with short-term timing anemia (Exhibit 2). Remember where we started with Exhibit 1, a chart you find in varied forms all over popular investing discussions, including many of our own. Looking back over long horizons (for example, rolling decades) when stock prices appear high (using Shiller’s CAPE here), it indicates below-average forthcoming returns, and conversely, low prices portend higher returns. Examining Exhibit 1, the effect is pretty big. But, alas, as shown in Exhibit 2, a real-time contrarian market timer has had a much tougher time taking advantage of this than you might guess from the longer-term results. Some of this applies going forward. For instance, “in sample” sorts like Exhibit 1 always overstate power as a result of hindsight bias. But some of the falloff is period-specific (and, yes, a specific period for market timing can be half a century), with stocks getting considerably more expensive over time. And one major drag on contrarian performance, that such a strategy implicitly goes “short” the successful trend-following strategy, may be fixable.
Next we have tried, while avoiding getting too fancy (as fancy often involves data mining), to make two very obvious straightforward improvements. We incorporate trend following as an equal partner to contrarian timing, much as is done with value and momentum throughout systematic investing (two arrows are better than one!). Also, we time not one but instead a measly two asset classes: stocks and bonds. These two improvements have a big impact. Nothing will make timing a panacea for which you should forsake all other strategies or take huge bets from. But in an overall investment program, we think the results of applying simple contrarian and trend timing to both stocks and bonds should yield them some shelf space among the other things you are doing. That is, these results should lead you into sin, but only a little.
Last, if you’re wondering, as of our writing this article, the CAPE signal says stocks are expensive (this system would underweight them by 12 percent), and the trend strategy is also mildly negative right now (this system would underweight it by 16 percent). So as of early October, this process would be sinning in the direction of lightening up on stocks (14 percent underweight, averaging the two). Bonds are very similarly 15 percent underweight, but it’s coming from very expensive valuations more than offsetting a nicely positive trend. Again, this is certainly not our, or the best possible, model. It’s just a simple, clear and intuitive one relatively free of data mining. Other factors (for example, carry in the form of a steep yield curve for bonds, relative valuation between stocks and bonds, some macro indicators) and other forecasting methodologies may be attempted, though you risk overfitting in exchange for attempted improvement. As an example of the difficulty of some of these decisions, we’d note that if instead of looking back 60 years, as we do, we looked back over the full past for as long as we have data (now more than 100 years), most things remain quite similar to the above, but stocks look considerably more expensive. We chose a simple intuitive model here for exposition and because we certainly think it’s within hailing distance of potentially better models, not because we argue it’s the clear best.
With all the caveats and uncertainties — and we can feel the trepidation of AQR’s legal team as we type (indeed, we do not use this exact model live) — we’d still give this simple but historically useful approach a bit of weight in your investment process, while acknowledging that many would wish to improve upon it. So feel free to blame us when this simple model fails, but only after waiting the appropriate half century.
Summing up in the plainest way possible, when prices look cheap versus a reasonable metric, buy a bit more. When they have been trending up, buy a bit more. Of course, also do the opposite, and average both these approaches, doing the most when they agree. Do it in both stocks and bonds. Avoid the other most common errors in timing that we highlight, which we think are just common sense. Do so, and we think you may be able to add a little return over the long term, avoid some of the worst pain, or experience a little of both. Neither sin nor savior.
Related readings on market timing.
Clifford Asness is managing and founding principal of AQR Capital Management, a Greenwich, Connecticut–based global investment management firm. Antti Ilmanen is a principal of AQR and heads up its Portfolio Solutions Group. Thomas Maloney is a vice president of AQR. The views expressed herein do not constitute investment advice or research and are those of the authors and do not necessarily reflect the views of AQR Capital Management, its affiliates or its employees.